Cadence upgrades debug for system-level era
Cadence Design Systems has launched a debug tool designed to improve the speed of bug hunting in SystemVerilog but which the company expects to grow into analog and post-silicon work.
“We surveyed our engineering base and found debug can consume 50 per cent or more of an engineer’s time,” said Adam Sherer, group director at Cadence.
Sherer claimed that although engineering teams often use visual debug tools such as Synopsys’ Verdi, many users have drifted back to the old techniques of embedding printf() statements in the SystemVerilog source code because they need to access data inside complex datatypes and enumerated variables.
“The printf() faded out 15-20 years ago but then it came back with with the adoption of SystemVerilog,” Sherer said.
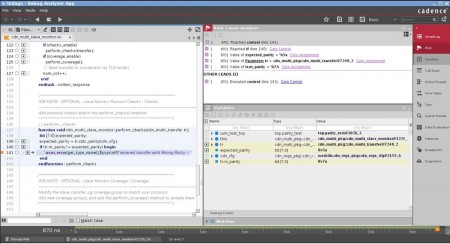
Image Screenshot of Cadence's Indago debugger
Indago is designed to avoid the need to rerun simulations to locate the sources of bugs. Instead, it collects as much data as it can to let a designer step through changes both forwards and backwards, including operations such as macro expansions.
To avoid clogging up the workstation with gigabytes of simulation data, Indago uses a moving-window approach, deleting data if it is not considered necessary for later use. But the tool does not demand that users set up watchpoints in advance in order to filter the flow.
Indago is accompanied by three apps that are likely to be joined by others. The first three focus on multi-language debug, supporting SystemC, Verilog and e; interfacing to software debug tools; and high-level protocol debug.
“Protocol debug is where visualization is very important. We want to see elements of the protocol and understand it as a protocol. Initially, we support AXI, ACE and DDR4 but the list will expand quickly,” Sherer said.
One of the features Cadence has added to ease debug is what the company calls root-cause analysis. The software looks for consistency problems, such as data types being mixed, which is a common source of errors and finds for the developer variables that are related to the one being traced.
“We believe over time we will be able to identify common failure patterns,” Sherer added.
Indago works with Cadence and third-party simulators, using the VPI protocol to fetch the data it needs. The tool also interfaces to the company’s vManager verification database to better control bug tracking and provide intelligence on when and where bugs are found and solved during development.
