By the numbers: investment, equipment, sales
We round up the latest headline forecasts and performance data from the Global Semiconductor Alliance (GSA), manufacturers association SEMI and the Semiconductor Industry Association.
Investment
The latest GSA Global Semiconductor Funding, IPO & M&A Update is something of a mixed bag. February 2012 was a better month for investment across the industry at $159.8M, up 237% month-on-month and 218% year-on-year.
Fabless companies performed best both in dollar terms and activity. Some 14 deals went through, eight in the fabless sector and six in that for semiconductor suppliers.
However, the data continues to show that newer companies continue to struggle to find backing with most investment going into second, third and fourth rounding funding. The only noted venture capital funding flowed in North America and Europe, favoring the former by almost three-to-one.
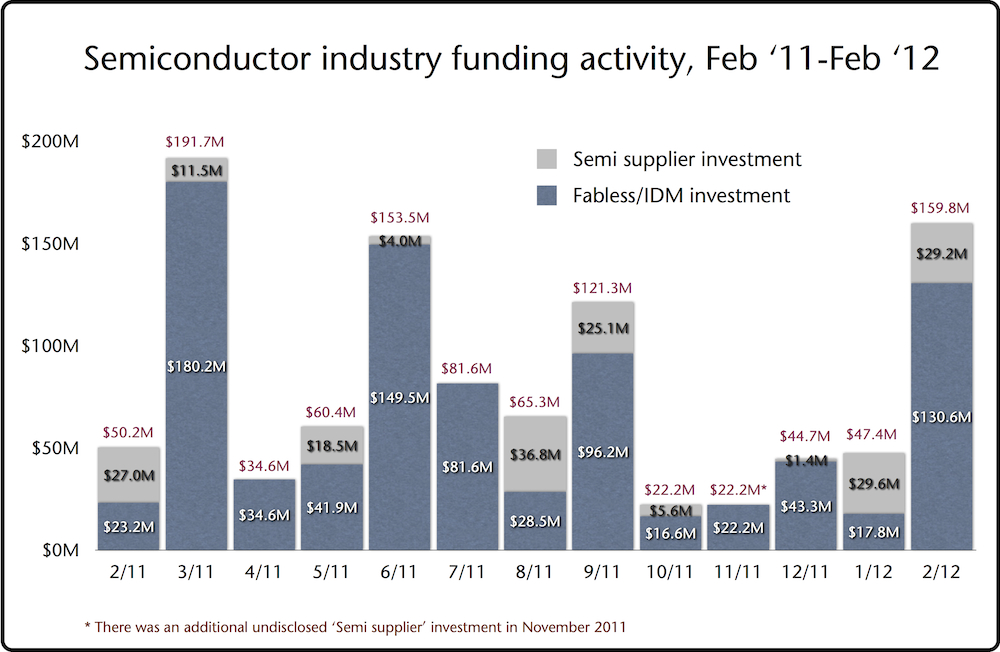
Figure 1
Investment shows signs of recovery. Source: GSA (Click image to enlarge)
Equipment
SEMI has just issued its latest Worldwide Semiconductor Equipment Market Statistics report showing that sales across all categories (wafer processing, assembly and packaging, test and other) rose 9% in 2011 to $45.53B.
But while wafer processing was up 15% and other rose 5%, assembly and packaging was down 14% and test dropped 9%.
Both Taiwan and China signaled an end to aggressive investment – at least over and above other regions – by emerging flat or, in Taiwan’s case (and led by TSMC’s review of its capex activities) down by almost a quarter.
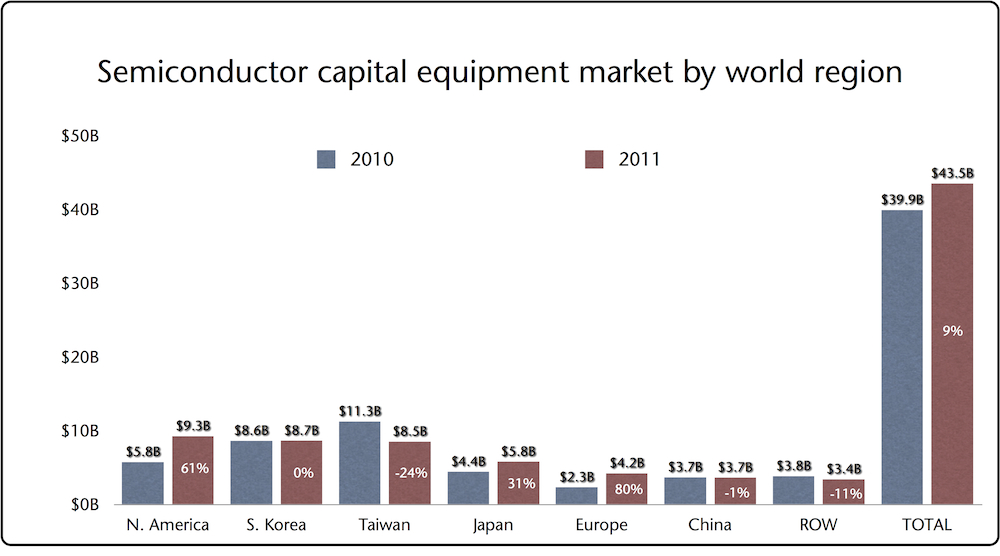
Figure 2
North America and South Korea got major boosts from Intel and Samsung. Source: SEMI (Click image to enlarge)
SEMI has separately reviewed the specific fab equipment sector which shows a solid but not entirely unexpected trend towards 350mm capacity.
SEMI analyst Christian Gregor Dieseldorff noted a ‘stampede of the giants’, though the final results showed a broader and higher level of investment against its original anticipations of falls in the overall numbers for 2012 and 2013.
“This analysis assumed more spending by Samsung and less by TSMC; at the time it was uncertain whether Hynix would increase or decrease spending,” Dieseldorff said.
“In fact, Hynix increased spending by 23% by about $3.75B while UMC increased spending from $1.6B to $2.0B. More surprisingly Intel increased spending much more than expected to a historic high of about $12.5B.”
Eight companies are expected to spend more than $2.0B this year (seven did in 2011), although the fab equipment forecast remains flat, still depending heavily on macroeconomic trends.
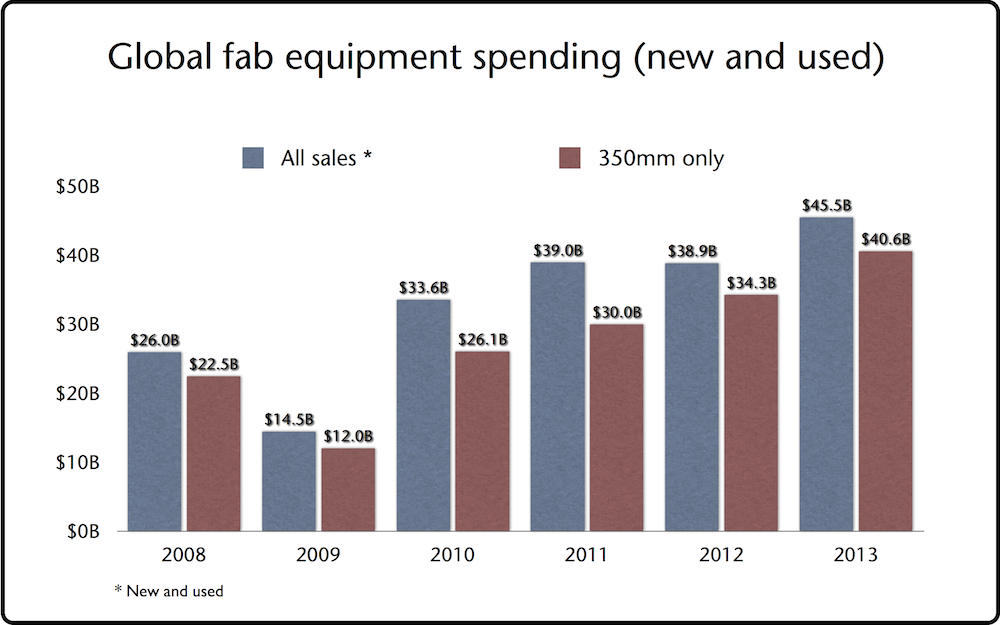
Figure 3
Spending will be flat in 2012 though 350mm is trending well. Source: SEMI (Click image to enlarge)
Sales
The latest WSTS statistics released by the Semiconductor Industry Association are the first since AMD and then Intel announced that they would no longer contribute to the data. Their concerns reflect a combination of cost-cutting (predominantly on AMD’s part) and fear of exposure (predominantly on Intel’s, concerned that if WSTS does not include AMD, its own MPU data will be too transparent).
The numbers continue to show a market waiting for a fuller recovery. The seasonal drop from December to January is an established post-holiday trend, but January 2012 was still a more significant 8.8% down on January 2011. The market remains troubled by both oversupply (memory being cited as the main culprit) and macroeconomic uncertainty.
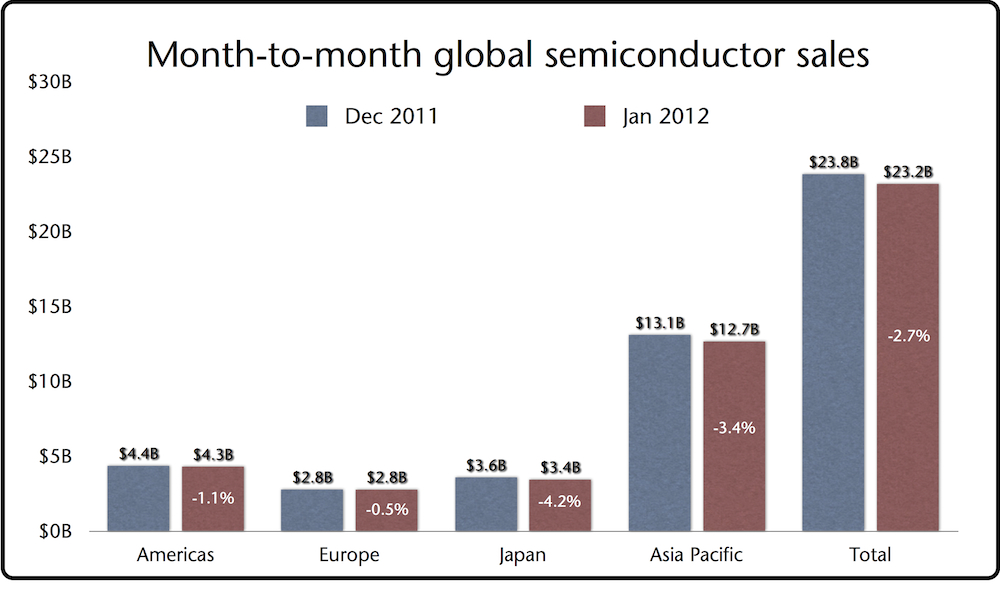
Figure 4
The December decline was traditionally seasonal. Source: WSTS/SIA (Click image to enlarge)
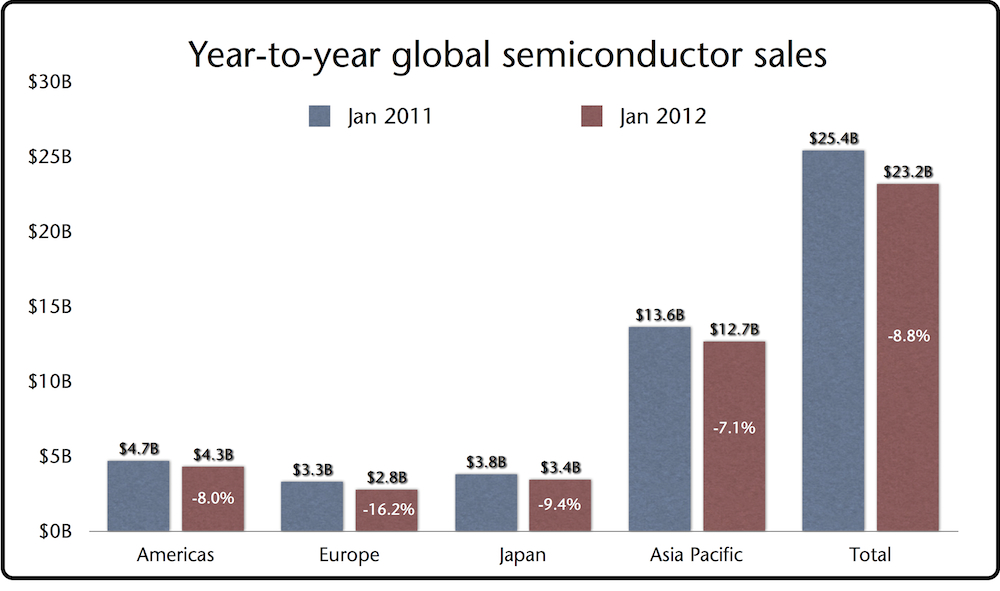
Figure 5
The decline on January 2011 is more of a concern. Source: WSTS/SIA (Click image to enlarge)