How IDEs enable the ‘shift left’ for VHDL
This series recently introduced the use of an integrated development environment (IDE) to develop designs and testbenches in the VHDL hardware description language. An IDE enables a more efficient development process and catches many errors early in the design phase. Previous articles have discussed advanced IDE features available to Verilog and SystemVerilog users. Engineers choosing VHDL have all the same challenges and would like all the same capabilities. This article discusses how an IDE can detect VHDL errors on the fly, suggest changes, and automatically correct code for better readability and maintainability.
IDE basics
IDEs were originally developed for programming languages, largely due to the inadequacies of traditional text editors. Viewing one file at a time and navigating with simple search commands does not scale for projects with hundreds or thousands of source code files. Just tracing a variable name across multiple files is tedious, sometimes requiring the use of system utilities such as the Unix/Linux ‘grep’ family of commands. The best text editors can recognize language constructs, highlight or color them, and detect some basic syntax errors. Providing more assistance to the programmer requires an IDE that ‘understands’ the language.
Hardware engineers writing design and verification code also used text editors in the past but have now followed their software colleagues into the better world of the IDE. In some ways, the IDE is even more important for hardware design than for software development. Deep knowledge of the underlying language (or multiple languages) in use enables sophisticated error-checking and auto-correction suggestions. The code is analyzed in context rather than as plain text, allowing the IDE to accomplish a wide range of powerful and valuable tasks, including:
- Running on-the-fly syntactic and semantic checks, and suggesting fixes;
- Performing advanced static analysis;
- Simplifying code navigation using hyperlinks, semantic searches, and signal tracing;
- Providing visual representations like design schematics and state machine diagrams;
- Speeding up code writing using auto-complete and code templates;
- Highlighting and formatting the code; and
- Linking to a simulator for runtime debugging.
These capabilities provide ease of use and efficiency when entering and editing designs and testbenches, performing detailed code reviews, understanding inherited code, and debugging failing test cases during verification. Although the focus of this article is on VHDL, the IDE must be able to compile and connect all design and verification languages, including SystemVerilog, Verilog, e, and C/C++. An intuitive graphical user interface (GUI) is a key feature, enabling easy navigation and interactive debug. Even a GUI feature as simple as one that collapses and expands sections of code can be helpful. The IDE can shave many months off a project schedule.
Auto-correction of coding errors
Many of the most valuable features of the IDE are enabled by its ability to compile the code ‘on the fly’ as the user edits it. Compilation gives deep insight into the design, which allows the user to check for semantic errors and other issues beyond pure syntax. The IDE re-reads the source code whenever engineers make changes and updates its internal database of the complete design and verification environment. This database spans all files in all languages, including VHDL. The IDE has powerful analysis engines constantly running behind the scene; these check new or changed code as it is written.
On-the-fly error checks find code issues at the earliest available point in a project. This fits very well into the electronic industry’s initiative to ‘shift left’ chip development as much as possible. This shift also contributes to shortening a project’s duration since it takes more time and resources to find and fix bugs at each progressive stage of development. The common ‘rule of 10’ estimates that debug effort increases ten times from coding to verification, with additional factors of ten if bugs slip into the bring-up lab or production.
The design knowledge embedded in the IDE enables much more sophisticated checks than a traditional text editor could ever perform. Because the IDE compiles the complete design and verification environment, it has the full scope of the code and can identify a wide range of inconsistencies. For many classes of coding errors, the IDE not only detects the problems but also makes ‘quick fix’ auto-correct proposals. Since no tool can possibly know exactly what the engineers originally intended, proposals must be accepted before any changes are made to the code.
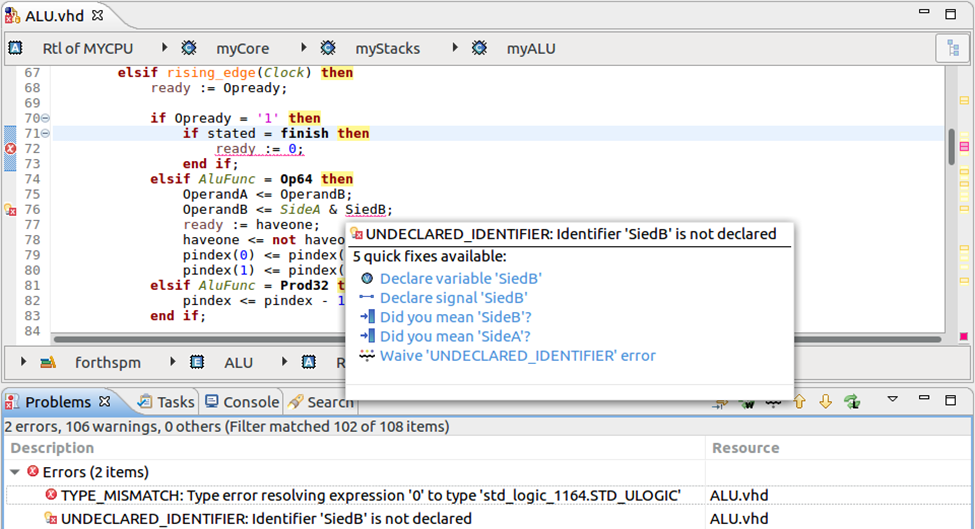
Figure 1 shows an example in which the IDE has detected two VHDL errors: a type mismatch and an undeclared identifier. The user has selected the latter error and is presented with several possible corrections. If the reference is a typographical error, the user can select the right identifier. If a new identifier is intentional, the IDE prompts for it to be defined and inserts the definition to the appropriate point in the code. This screenshot and the others that appear in the following examples are from the Design and Verification Tools (DVT) Eclipse IDE from AMIQ EDA.
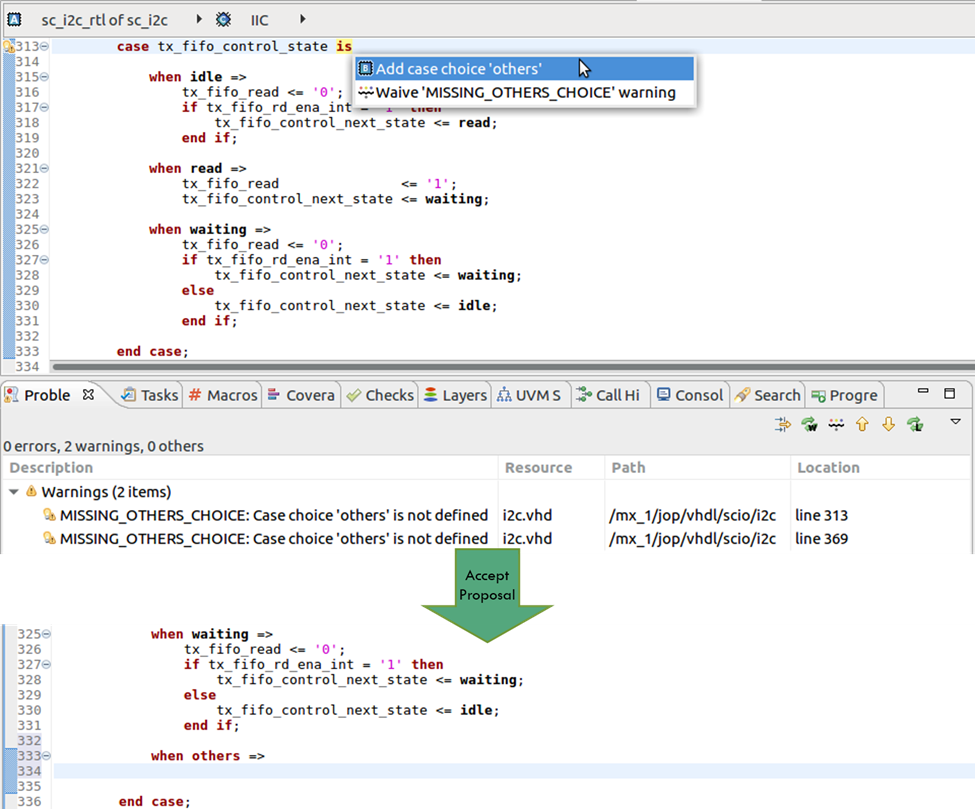
Figure 2 is an example of a proposal that is only possible where the IDE has a deep knowledge of VHDL semantics. The checks have detected that a case statement is missing a case alternative. If the user accepts the quick-fix proposal, the missing case alternative is added at the end of the case construct.
Omitting an item in a sensitivity list is a particularly insidious error common when coding in VHDL. The code inside such a list is only evaluated if at least one of the items in the list changes its value. This is risky since omitting a signal may lead to latch insertion during synthesis, something that is usually unintended and undesirable. Figure 3 shows an example in which only three signals are listed, although the ‘load_p’ signal is also used in the code covered by the sensitivity list. A change in the value of this signal would not trigger the code and the possible assignment within the ‘if’ statement would not occur. In Figure 3, the proposal to add the missing signal to the sensitivity list has been accepted.
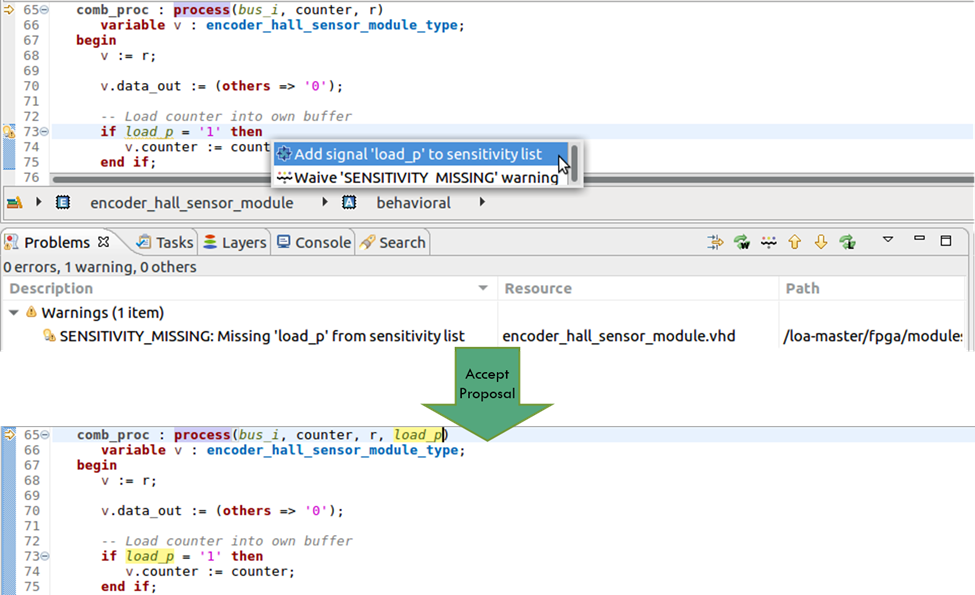
Figure 3. The IDE can propose adding a missing signal to a sensitivity list (AMIQ EDA – click to enlarge)
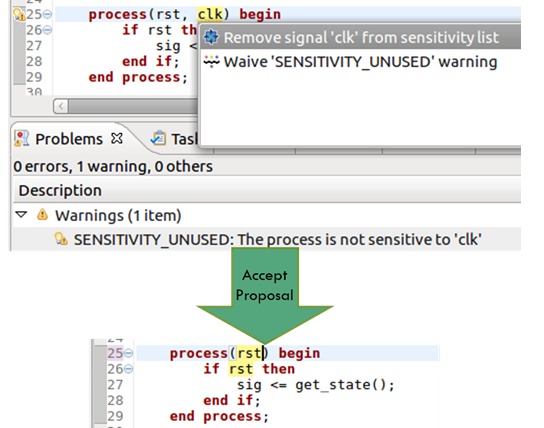
Missing items in sensitivity lists is can be hard to debug in simulation, requiring much back-tracing to find the source of incorrect data. The IDE provides a far more efficient solution by finding and reporting the missing signal during coding and offering a quick fix proposal. The IDE also detects spurious signals in sensitivity lists and proposes to remove them to speed up simulation by eliminating unnecessary evaluations. Figure 4 shows an example.
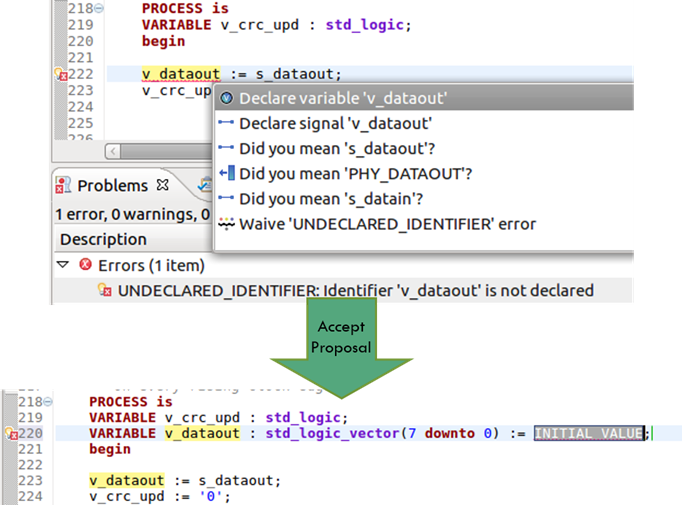
Beyond sensitivity lists, the IDE can detect identifiers that are missing in other parts of the code, suggesting corrections for possible typos, or automatically adding new signals, arguments, and variables as selected by the user. This commonly happens when a user references an identifier not yet declared. Figure 5 shows the IDE adding the declaration for the new ‘v_dataout’ variable.
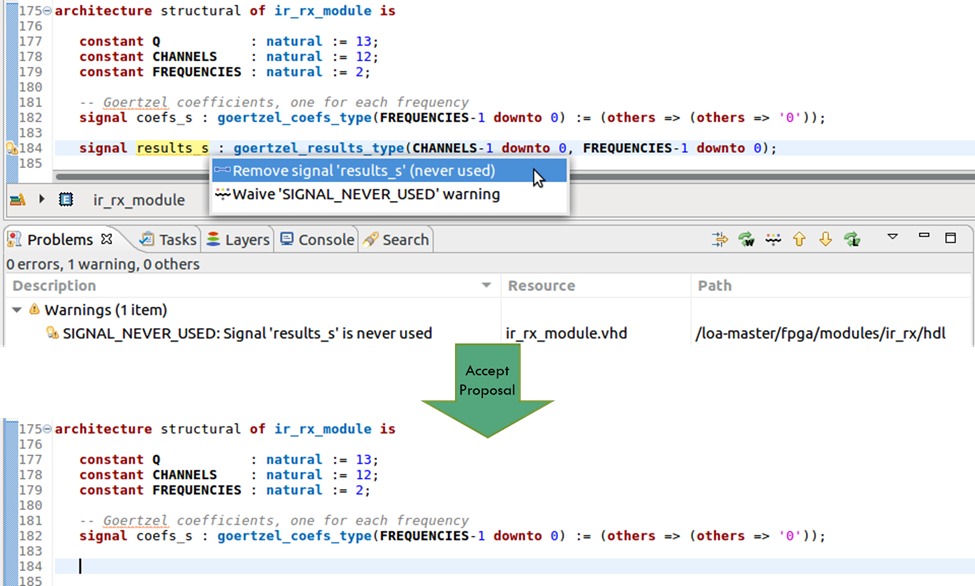
The IDE is clever in its addition of a missing identifier, inferring the type automatically from context. When the same undeclared identifier is used across multiple scopes, the declaration is placed in such a way that it is visible for all usages. The IDE also detects signals that are never used and flags them with warnings. Such signals may occur when functionality is deleted or moved. Leaving unused signals in the code does not affect functionality but removing them improves code readability and maintainability. Figure 6 shows the IDE automatically deleting an unused signal automatically after user approval.
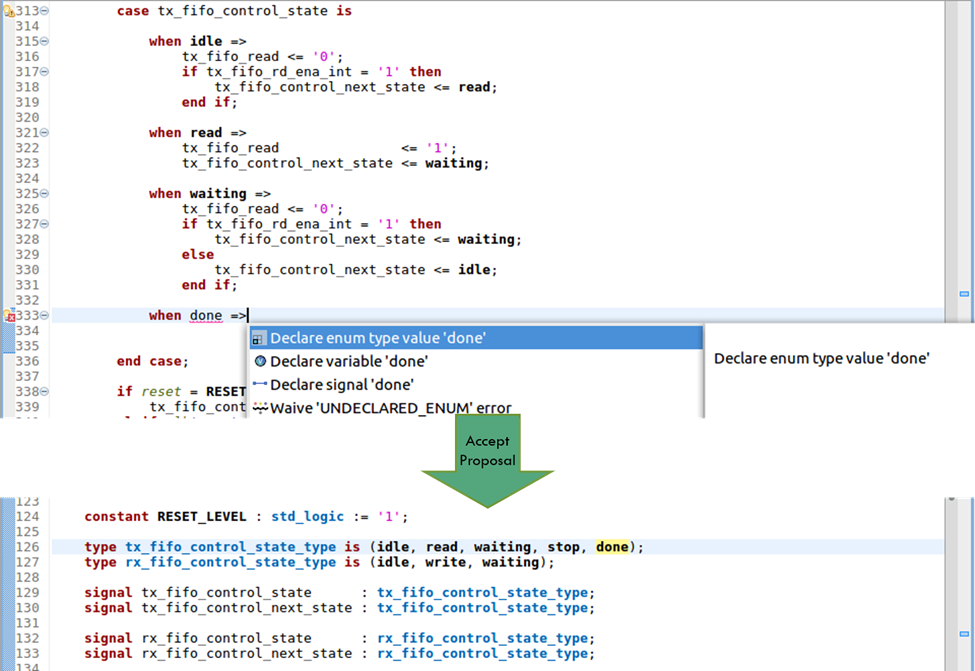
When it comes to readable code, enumerated types are highly desirable. Values referenced for an enumerated type must match the declaration, and engineers sometimes add a value without declaring it. Figure 7 shows the use of an undeclared value (‘done’); the IDE detects this error and proposes to insert it in the type declaration. The user has accepted the quick fix proposal and the result is as shown.
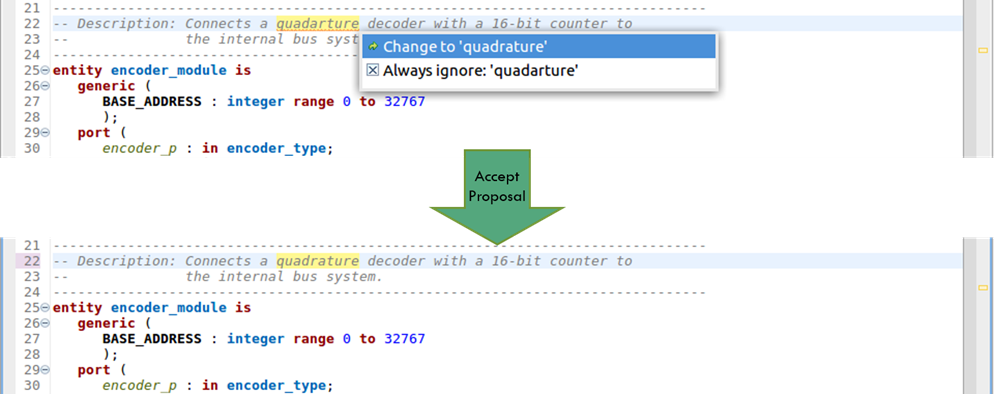
Although they might not be considered functional bugs, typographical errors in text strings and comments reduce the clarity of code. The IDE includes a spelling check, with the option to accept or ignore the proposed fix. If accepted, the change is made automatically to the code, as shown in Figure 8.
Conclusion
The subtleties of VHDL and the diverse rules for design and verification mean that writing quality code is a challenging process with ample opportunity for errors. In addition to its general coding support and intuitive GUI, the IDE provides auto-correct features. Checking coding errors on the fly and assisting engineers with quick fix proposals is a significant shift left in the development process. It also yields VHDL that is more efficient, more readable, and more maintainable. The end result is better code in less time, making the IDE a must-have for design and verification projects.
Further reading
This article is the tenth in a 12-part series providing a comprehensive and detailed analysis of the value and deployment of IDEs. You can access all the other parts by following the links below, presented in order of publication. You can also learn more about the Eclipse IDE from AMIQ EDA by following this link.
- Why hyperlinks are essential for HDL debugging
- A helping hand for design and verification
- Correct design and verification coding errors as you type
- Take advantage of the automated refactoring of design and verification code
- Delivering on the advanced refactoring of design and verification code
- Achieving the interactive development of low-power designs
- Accelerating the adoption of portable stimulus
- Accelerate your UVM adoption and usage with an IDE
- VHDL users also deserve efficient design and verification
- How IDEs enable the ‘shift left’ for VHDL
- Extract benefit from the automated refactoring of VHDL code
- e language users deserve IDE support too
 Tom Anderson is a technical marketing consultant working with multiple EDA vendors, including Agnisys. His previous roles have included vice president of marketing at Breker Verification Systems, vice president of applications engineering at 0-In Design Automation, vice president of engineering at IP pioneer Virtual Chips, group director of product management at Cadence, and director of technical marketing at Synopsys.