Accelerate your UVM adoption and usage with an IDE
Over the last 30 years, many aspects of semiconductors design and verification have changed. In design, the adoption of logic synthesis has had the biggest impact; increased design reuse, including the rise of the commercial IP business, is probably second. In the verification realm, there are several strong contenders. Formal verification has moved into the mainstream, verification planning has become more structured, a wider range of coverage metrics is in use, and the design IP market has been complemented by verification IP.
However, there is little doubt that the adoption of constrained-random testbenches has been the most significant change during this period. The technique became mainstream largely due to the release of the Universal Verification Methodology (UVM), which built on the verification constructs in SystemVerilog. The ability to create verification IP and constrained-random testbenches in a standard, interoperable manner brings many benefits. Unfortunately, UVM is complex and usage is not always easy. This article discusses a way to address this quandary and accelerate adoption and deployment of the methodology.
Inside constrained-random testbenches
Verification of chip designs used to be easy to explain but hard to execute successfully. The verification team went through the design specification line-by-line and compiled a list of features that needed to be verified. These were included in the verification plan (text document or spreadsheet), and then the verification engineers went dutifully through the list of features, developing one or more simulation tests for each. They would run the tests, fix any design bugs uncovered, and check off the feature in the verification plan. When all features were checked, the design was deemed ready for tapeout.
Hand-writing tests could be challenging; it was not always easy to see how to stimulate from the inputs those features buried deep in the design. But the biggest issue with hand-written tests was that some functionality might never be verified. If the verification team missed a feature when reviewing the spec, or wrote tests that did not actually verify a feature, they might never know that parts of the design were inadequately exercised. This would very likely lead to bugs in silicon, requiring software workarounds if possible and a chip turn if not.
Verification teams tried to address the situation by inserting some randomization into the tests, especially for data values. Many also adopted code coverage, sometimes supplemented with some hand-written functional coverage monitors, to see how well the design was being exercised. Covering a line in the RTL provided no guarantee that there were no bugs, but lack of coverage meant that any bugs would be missed for sure. The desire to apply randomization more intelligently and to use coverage metrics rather than a test checklist as a measure of verification completeness led directly to the introduction of constrained-random testbenches.
Truly random input values in simulation rarely make sense; there are all sorts of rules about which values can be applied when. In constrained-random verification, these rules are codified with constraints. Stimulus is generated randomly, but within the bounds of the constraints, so that simulation tests remain within the range of behavior intended for the design. There is no limit to the number of automated self-checking tests that can be generated and run, although at some point the verification team still needs to declare the design ready for tapeout.
Since there is no longer a direct correspondence between features in the verification plan and the tests run in simulation, functional coverage is the key metric for completion. The verification team inserts coverage statements for all the features, and as these are exercised the results can be automatically annotated back into the plan. Code coverage is sometimes used as a backup metric to ensure that no features are missed, and constrained-random tests may find bugs in features that are not (yet) in the verification plan. The result is extensive verification with a high degree of tape-out confidence.
Inside UVM
Constrained-random testbenches were around well before UVM came along. The Specman tool and e language from Verisity (acquired by Cadence) and the Vera solution from System Science (acquired by Synopsys) had many features that influenced the inclusion of constrained-random testbench support in the SystemVerilog standard. Verisity found that a raw language was not enough to develop testbenches in a consistent way and so defined the e Reuse Methodology (eRM) with a collection of library elements and documentation.
When SystemVerilog appeared, the experience was repeated. Cadence developed the Universal Reuse Methodology (URM) and Mentor defined the Advanced Verification Methodology (AVM), followed by Synopsys and ARM collaborating on the Open Verification Methodology (OVM). All four methodologies fed into UVM which, like SystemVerilog itself, was developed and standardized by Accellera. With UVM, the chip industry began widespread adoption of constrained-random verification.
Figure 1 shows a typical UVM-based testbench, based on diagrams from the Accellera standard documents. A single top-level testbench generates many tests using sophisticated sequences to provide constrained-random stimulus on the inputs. The tests are self-checking, often involving reference models to determine whether the RTL design is producing the correct results. A variety of monitors and scoreboards checks protocols and determines coverage metrics. UVM environments can be nested, so IP vendors or internal design teams can provide verification components along with their RTL.
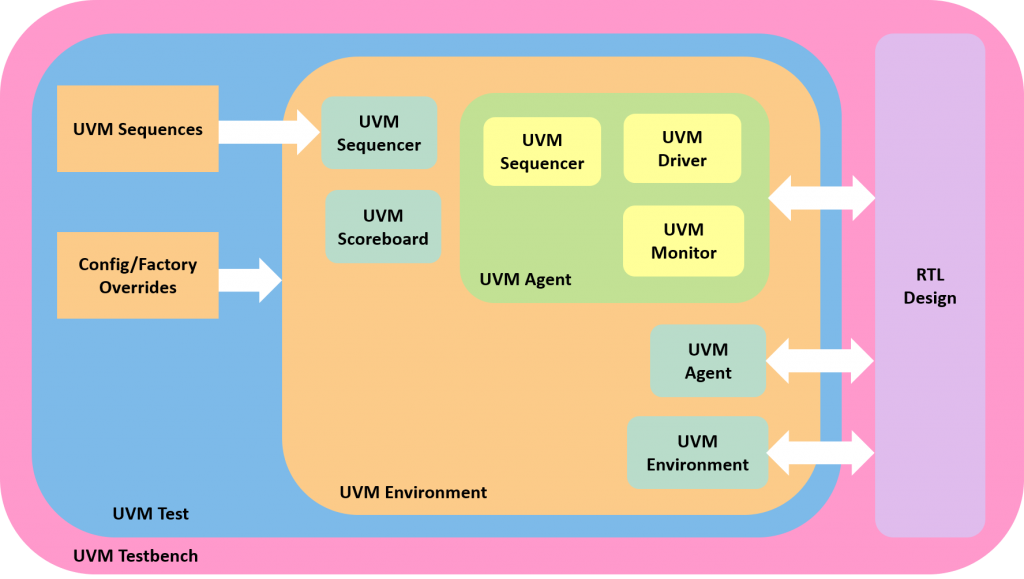
Figure 1. The UVM defines a standard setup for the testbench and tests (AMIQ EDA – click to enlarge)
UVM is very powerful and very flexible, but it is also very complicated. It is built on object-oriented programming (OOP) concepts, including classes with methods that operate on data. OOP structures can be extended or overwritten, offering many opportunities to provide a generic library element that can be customized as needed by users. Most designers have no OOP experience at all, although some verification engineers have used C++ or Java and so have a working knowledge of the key concepts.
One metric for the complexity of UVM is the size and depth of the library. The latest release from Accellera, version 1.2, has a reference manual of 938 pages and a user’s guide with 190. The index in the reference manual has nearly 2,000 entries. No one can possibly remember every class, method, type, macro, variable, and constant defined by UVM. Learning a workable subset is a significant hurdle for new adopters, and even experienced users must search the documents to find constructs they do not use every day or have not used in a while. A better approach is needed to take advantage of the benefits of UVM more easily.
The role of an IDE
The concept of the integrated development environment (IDE) was originally developed for programmers to make it more efficient to write and debug their software. IDEs reduce the learning time for new programmers and save time and effort for common operations even for language experts. Many software engineers regard IDEs as essential parts of their tool kit. Among its other benefits, an IDE can:
- Perform many types of checks on the code;
- Highlight and format the code according to user preferences;
- Compile the code to present the complete design and testbench structure;
- Connect to a simulator for debugging failing verification test cases; and
- Provide an intuitive graphical user interface (GUI) for code development.
Hardware design and verification engineers are also coders, and naturally they have wished to make many of the same benefits available to their colleagues in software. Today, IDEs are available for SystemVerilog, Verilog, VHDL, e, C/C++/SystemC, the UPF and CPF power-intent formats, and the Portable Stimulus Standard (PSS). Some types of standard libraries are also supported, with their elements recognized and treated appropriately by the IDE. Chip engineers can develop, test, and debug their code interactively and manage complex projects with thousands of RTL design and testbench files.
The IDE compiles all the design and verification source code, building an internal database of the complete environment. It leverages the knowledge encapsulated in this database to provide features far beyond those of traditional text editors. The IDE can traverse deep design and testbench hierarchies, suggest possible fixes for coding errors, refactor code to be more efficient and maintainable, auto-complete partial inputs, and provide templates for adding new code. Many of these capabilities are now available for UVM.
Interactive UVM development and debug
Although UVM is a library built on SystemVerilog and not a language it its own right, it benefits equally from IDE support. The internal model compiled by the IDE includes the UVM library elements, enabling a wide range of analysis and interactive features. These include navigating through the design, detecting errors, suggesting fixes, auto-completion, and providing coding templates. The IDE understands all aspects of UVM so it can recognize classes, methods, types, macros, variables, and constants.
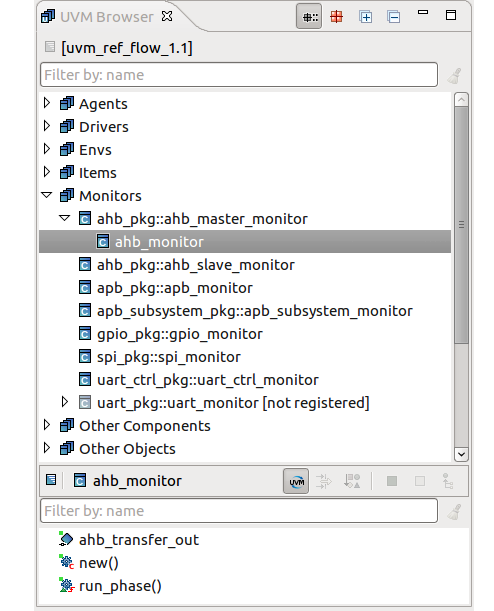
As shown in Figure 2, the IDE also understands which UVM elements in the testbench are agents, drivers, interfaces, monitors, ports, scoreboards, sequencers, tests, and other components and objects. The UVM Browser View is an intuitive entry point for exploring a UVM-based verification environment, with all the elements grouped by categories. The inheritance hierarchy between classes is shown up to the UVM base class. Users can easily view the testbench and inspect the UVM application programming interface (API). This screenshot and remaining figures are from the Design and Verification Tools (DVT) Eclipse IDE from AMIQ EDA.
The IDE offers a variety of views to provide verification engineers deep insight into the UVM testbench and its elements. The Verification Hierarchy View makes it easy to visualize the testbench organization and to generate Component Diagrams such as the one shown in Figure 3.
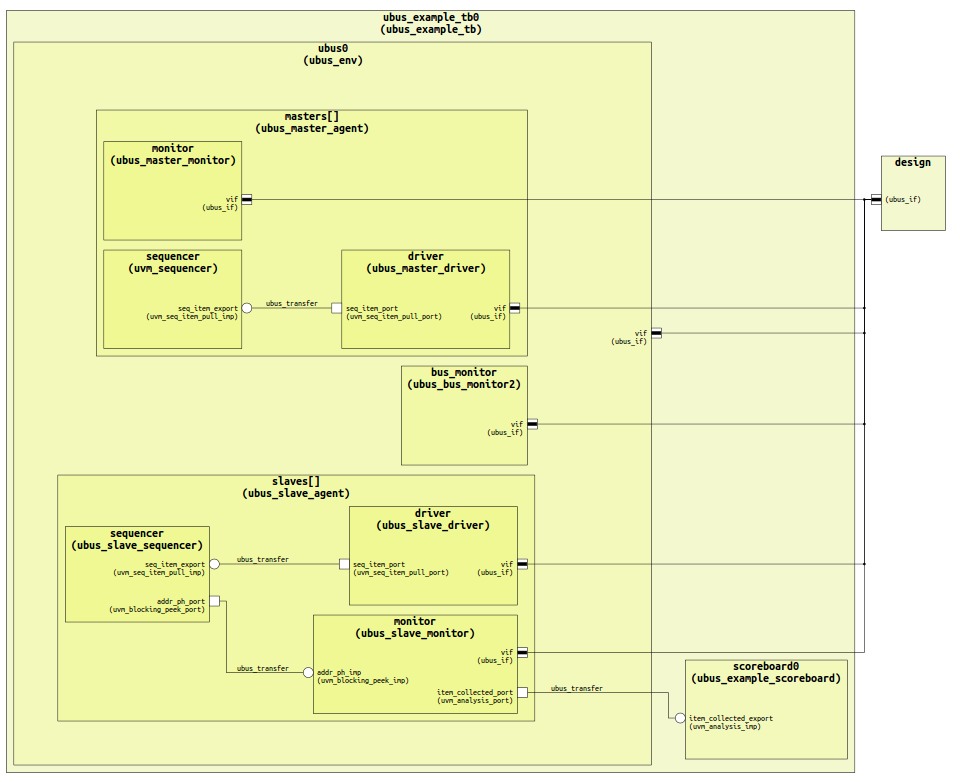
Figure 3. The IDE can generate a Component Diagram showing the testbench hierarchy (AMIQ EDA – click to enlarge)
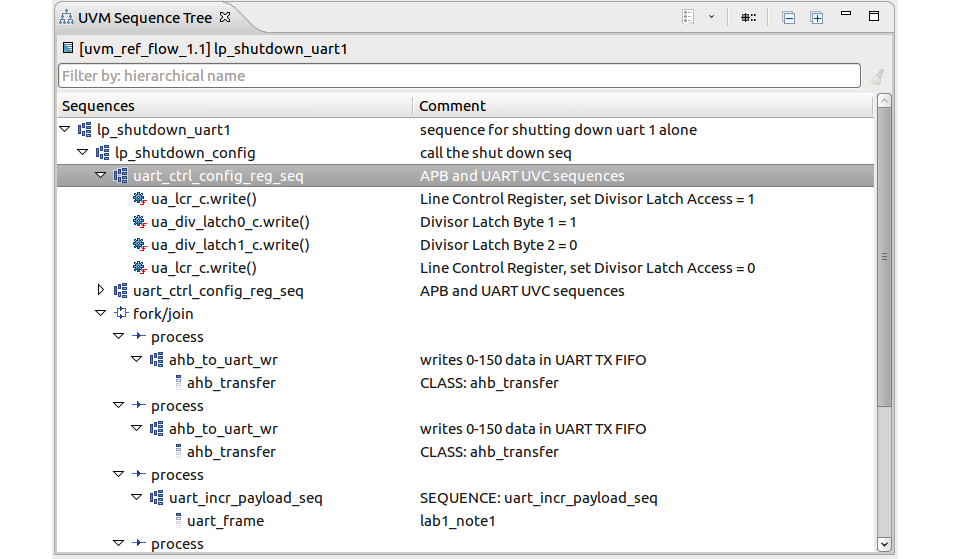
As shown in Figure 4, the UVM Sequence Tree View presents the complete call tree of a UVM sequence. The call tree is made of all sub-sequences that are triggered by the top-level sequence, recursively down to leaf sequence items.
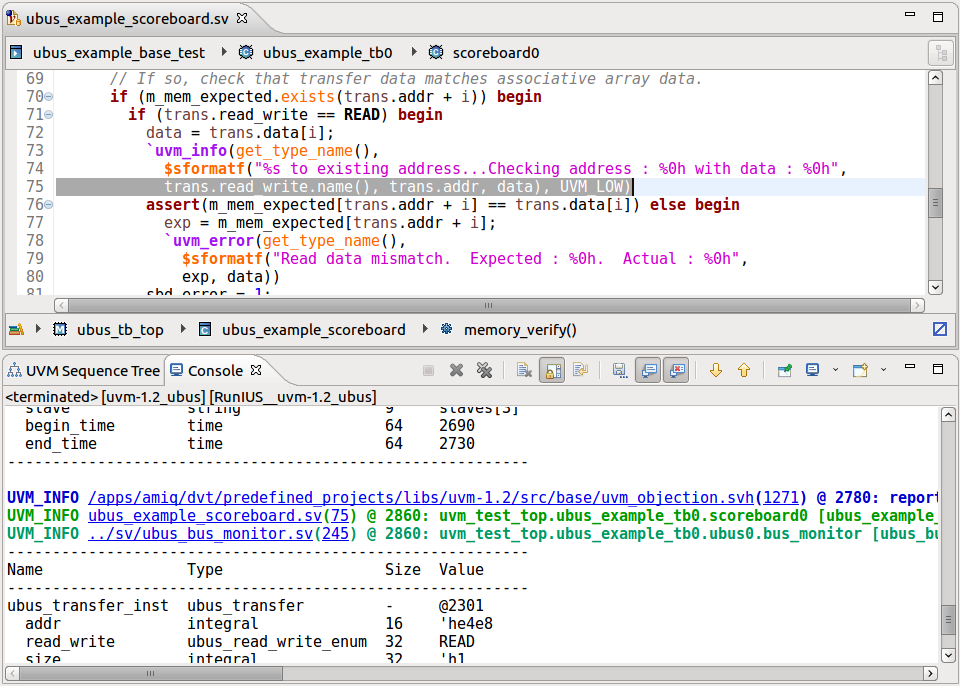
Another IDE view provides a smart log that displays colored and hyper-linked logs. Figure 5 shows the user selection of a UVM information message and a highlighted log of console output that includes hyperlinks to the source code.
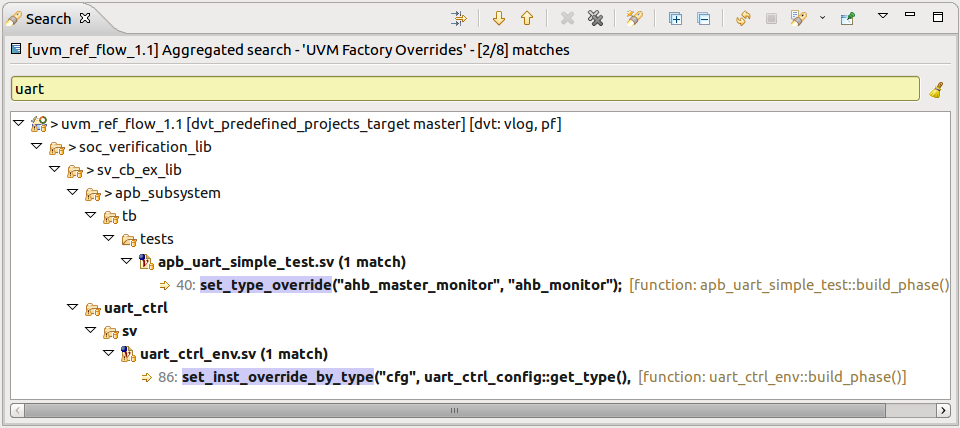
In addition to views that present information and provide hyperlinks, the IDE offers interactive ways to explore and find out more information about the testbench. Factory Queries quickly and accurately locate UVM factory-related constructs that may influence the behavior of the testbench, as shown in Figure 6. These queries cover methods that get configuration information, set configuration values, and override factory settings.
The IDE greatly improves visibility and understanding of UVM code, and it also provides features to help develop and modify the code. One example is the UVM Field Editor wizard, which lists all the fields in a class. Users can register or unregister the class; when the class is registered, they can register or unregister fields. When selecting a field, they can find information about the macro used for registration Figure 7 shows this wizard.
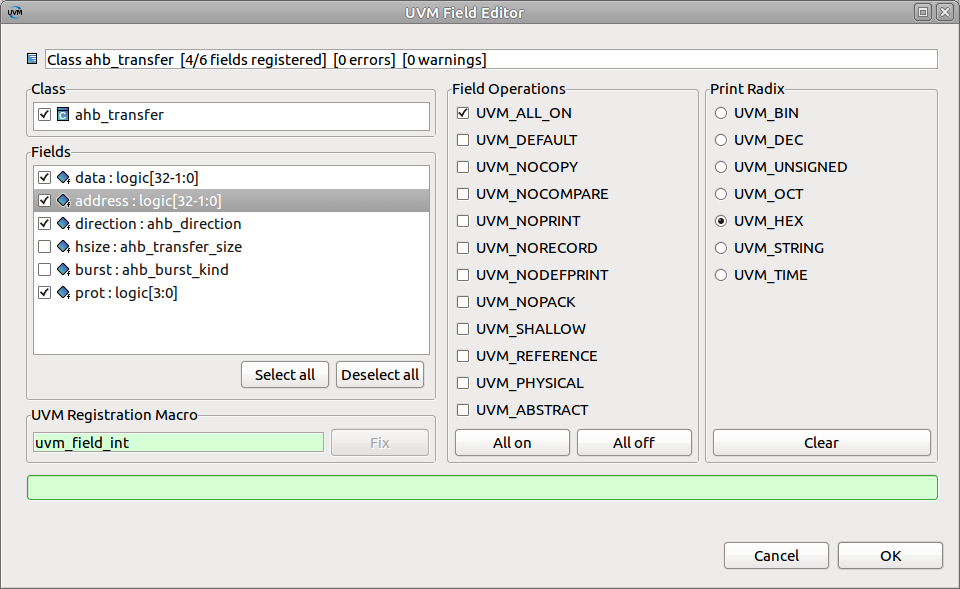
Figure 7. The IDE provides a wizard to control class and field registrations with the UVM factory (AMIQ EDA)
When writing testbench code, the IDE provides many capabilities for both general SystemVerilog and UVM in particular. These include autocomplete templates for UVM testbench elements. When the user types in ‘uvm’ the IDE will display a drop-down list of possible completions. After selecting the desired template, the user can fill in template parameters such as company prefix and component name etc. This process is shown in Figure 8.
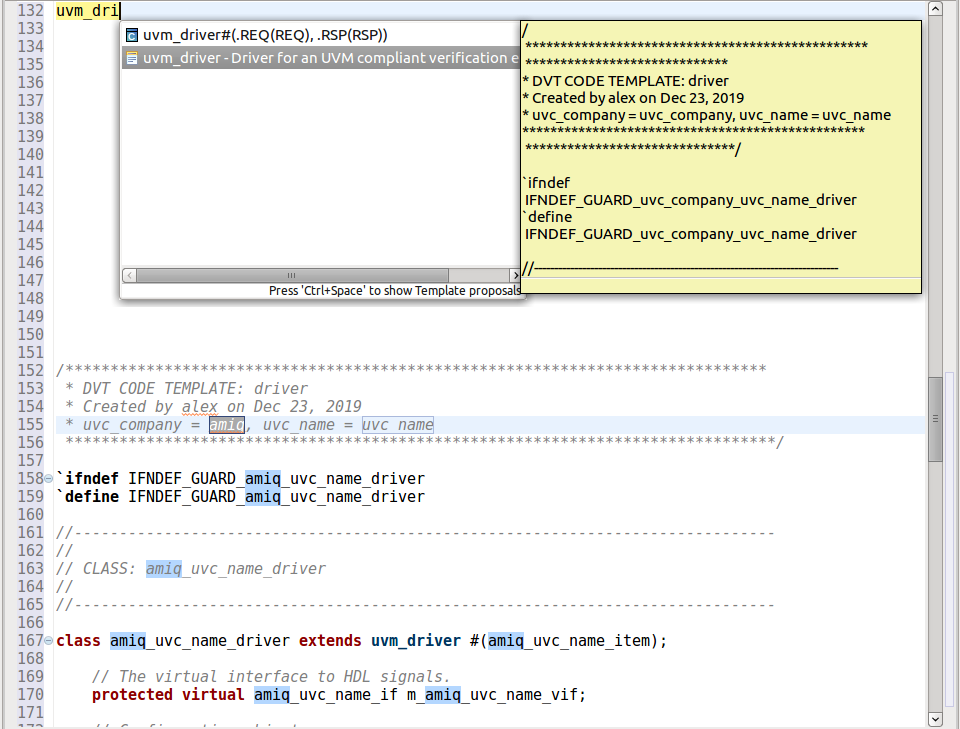
Figure 8. The IDE provides autocompletion templates for UVM components (AMIQ EDA – click to enlarge)
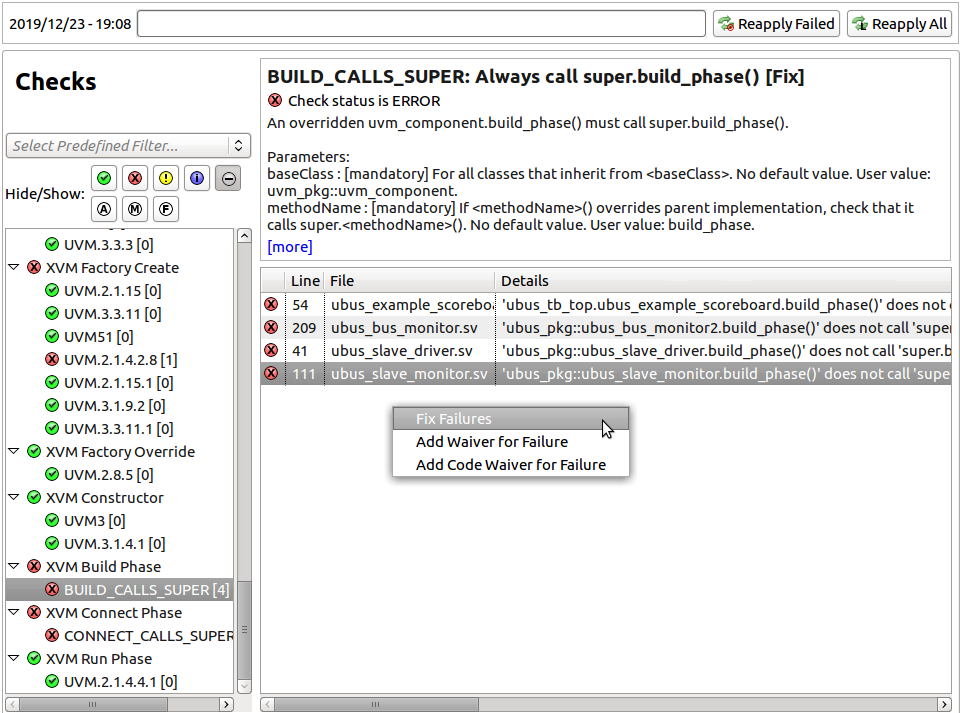
Once the verification team has completed a section of UVM testbench code, they may want to analyze it to find methodology violations. The Verissimo SystemVerilog Testbench Linter from AMIQ EDA provides this capability, and it is tightly integrated with the DVT Eclipse IDE. The user can perform a detailed UVM compliance review for the entire project, selecting the desired checks as shown in Figure 9. Violations can be displayed and debugged, or waived if the users choose to do so. The testbench architecture is detected automatically and filters are available to control the results viewed.
Conclusion
The UVM standard dramatically changed the landscape for semiconductor verification and brought constrained-random testbenches into the mainstream. However, the complexity of the methodology and the sheer size of the library make adoption difficult and present challenges even for experts. A UVM-aware IDE provides highly valuable assistance to both new and experienced users when writing, editing, analyzing, and debugging testbenches. The IDE is an essential part of a verification team’s toolkit.
Further reading
This article is the eighth in a 12-part series providing a comprehensive and detailed analysis of the value and deployment of IDEs. You can access all the other parts by following the links below, presented in order of publication. You can also learn more about the Eclipse IDE from AMIQ EDA by following this link.
- Why hyperlinks are essential for HDL debugging
- A helping hand for design and verification
- Correct design and verification coding errors as you type
- Take advantage of the automated refactoring of design and verification code
- Delivering on the advanced refactoring of design and verification code
- Achieving the interactive development of low-power designs
- Accelerating the adoption of portable stimulus
- Accelerate your UVM adoption and usage with an IDE
- VHDL users also deserve efficient design and verification
- How IDEs enable the ‘shift left’ for VHDL
- Extract benefit from the automated refactoring of VHDL code
- e language users deserve IDE support too
 Tom Anderson is a technical marketing consultant working with multiple EDA vendors, including Agnisys. His previous roles have included vice president of marketing at Breker Verification Systems, vice president of applications engineering at 0-In Design Automation, vice president of engineering at IP pioneer Virtual Chips, group director of product management at Cadence, and director of technical marketing at Synopsys.