VHDL users also deserve efficient design and verification
Over the past year, this series of eight articles has discussed challenges in writing and debugging design and verification code for semiconductors. The key technology is the integrated development environment (IDE), a tool first developed for software programming languages but also highly valuable for hardware description languages (HDLs) such as Verilog, its successor SystemVerilog, and VHDL. All the HDL examples in the previous articles were written in SystemVerilog (a superset of original Verilog), which most surveys report to be the most widely used HDL. A quick scan of online commentary shows more than a few SystemVerilog users declaring, “VHDL is dead!”
In truth, VHDL is very much alive. It is still widely used to describe hardware designs, and recent extensions have made it more powerful for verification with simulation testbenches as well. VHDL was originally developed in response to a directive from the United States Department of Defense and remains the HDL of choice for many military and aerospace applications. It also remains the most common language in several European companies. VHDL was widely used for early programmable logic synthesis tools, and it remains considerably more popular with FGPA designers than ASIC development teams.
The many VHDL users have the same challenges as their SystemVerilog colleagues, and they deserve a solution every bit as powerful. This article shows how an IDE benefits design and verification engineers coding in VHDL.
Motivation for an Integrated Development Environment
Before the advent of IDEs, programmers and engineers had to rely on text editors to enter, modify, and maintain their code. There are many limitations to this approach, especially for large projects that involve hundreds or thousands of source code files. Tracing a variable or signal name from one file to the next once required a tedious iteration of operating system commands such as the Unix/Linux ‘grep’ utility to identify files of interest and ‘search’ or ‘find’ functions within the text editor to locate the target name. Similarly, the seemingly simple task of renaming a variable or signal could involve juggling numerous files in a tool designed to edit one file at a time.
Text editors also have limitations in how well they ‘understand’ HDL design and verification code. Some can highlight or color code to separate language constructs from user-defined names, and the best text editors can do some basic language syntax checks and perhaps suggest some possible fixes when errors are detected. More advanced capabilities require a tool that can compile the complete design and testbench into a single model. Such a tool can traverse the complete model and have deep insight into the semantics and structure of the design and testbench. This is precisely where an IDE comes into play.
Stepping up from a traditional text editor to an IDE enables a huge range of capabilities for design and verification engineers. The IDE is tuned to the specific language (or languages) being used, so the code is analyzed in context rather than as plain text. The IDE can accomplish a wide range of powerful and valuable tasks, including:
- Running on-the-fly syntactic and semantic checks, and suggesting fixes;
- Performing advanced static analysis;
- Simplifying code navigation using hyperlinks, semantic searches, and signal tracing;
- Providing visual representations like design schematics and state machine diagrams;
- Speeding up code writing using auto-complete and code templates;
- Automating code refactoring, such as changing the name of a signal across the entire design;
- Highlighting and formatting the code; and
- Linking to a simulator for runtime debugging.
These capabilities provide ease of use and efficiency when entering and editing designs and testbenches, performing detailed code reviews, understanding foreign code, and debugging failing test cases. Wrapping these capabilities with an intuitive graphical user interface (GUI) provides a solution that can shave many months off a schedule. Although the focus of this article is on VHDL, the IDE must be able to compile and connect all design and verification elements, including those written in SystemVerilog, Verilog, e, or C/C++.
Efficient VHDL code traversal
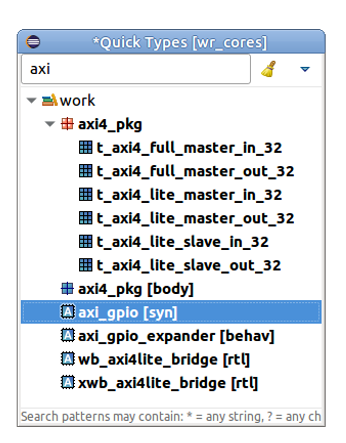
Because it is an interactive, GUI-based tool, the IDE makes it easy to search across files, search within files, and explore the complete model of the design and testbench. For example, the declaration for a specific type (entity, architecture, or user-defined type such as an enum or record) can be opened with a simple key combination. Figure 1 shows a view in which the user can enter any pattern to locate the type, select an item in the list, and jump to its declaration. Typing only a few letters from the entity name quickly locates it and navigates to the source code. This screenshot and those in the following examples are from the Design and Verification Tools (DVT) Eclipse IDE from AMIQ EDA.
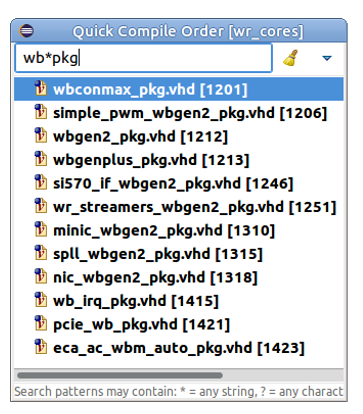
Thus, making project queries and traversing among files is straightforward. General searches across multiple files are also easy, with no need to leave the IDE to invoke ‘grep’ or other system ‘find’ utilities. In Figure 2, the user types a pattern or a few letters from a file name into a search window, which then displays all files with matches. Clicking on an item in the list opens the file.
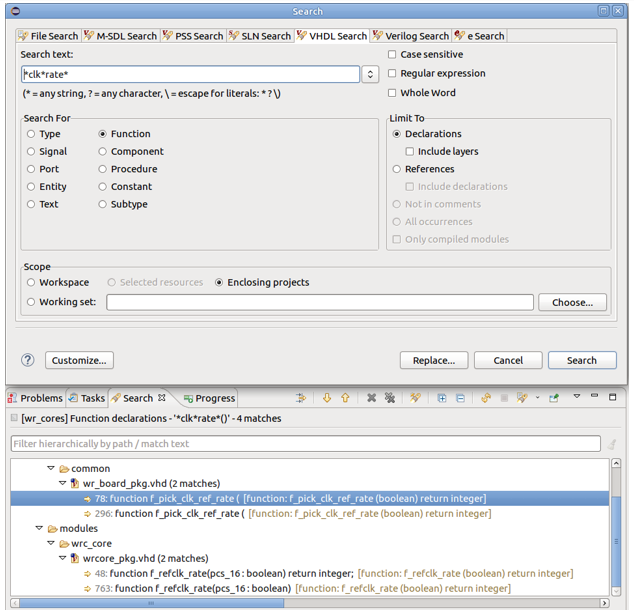
The IDE also supports intelligent searches across the contents of multiple files. As shown in Figure 3, the user can search for general text or restrict the results to an entity, function, signal, etc. This feature speeds up design exploration and debug from many minutes to a few seconds. The ‘grep-search’ cycle required with text editors is eliminated, and the IDE is not confused by similar names or even the same name in different scopes.
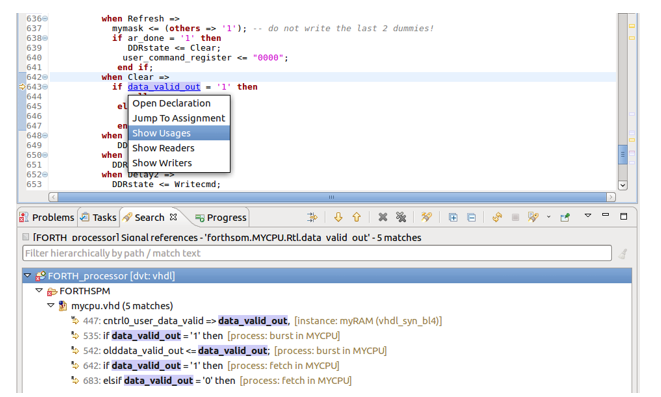
The IDE borrows the concept of hyperlinks from Web browsers as a main method for exploring the design and testbench. This enables tracing signals across files, easily jumping from any signal, type, method, field, etc. to its declaration, even if it is in another user file or a library and several other navigation capabilities. For example, to find where a procedure, signal, architecture, or any other entity is declared or used, the user simply hovers over its name while holding down the ‘Ctrl’ key. This turns the name into a hyperlink and presents the user with a drop-down menu of options. As shown in Figure 4, the user can find usages and, for variables, ports, or generics, find readers and writers as well.
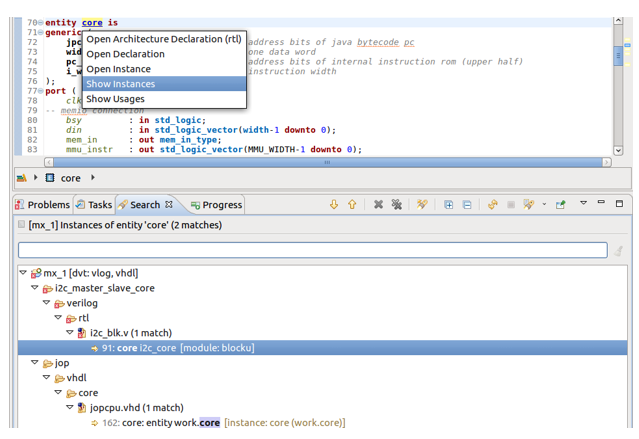
To see all instances of an entity or a component, the user similarly hovers over its name with the mouse cursor while holding down the ‘Ctrl’ key. Figure 5 shows an example of hyperlinking an entity and selecting the option to show all its instances.
When traversing code, perhaps the biggest advantage of the IDE over a text editor is the IDE’s ability to trace signals across multiple levels of hierarchy and multiple files. A signal may go to many different loads, crossing dozens of levels up and down the design hierarchy. Figure 6 shows a menu allowing the user to trace the source and destination connections of a signal. As with other types of searches, the IDE has a complete model of the hierarchy so it can go to precisely the right locations in the right files.
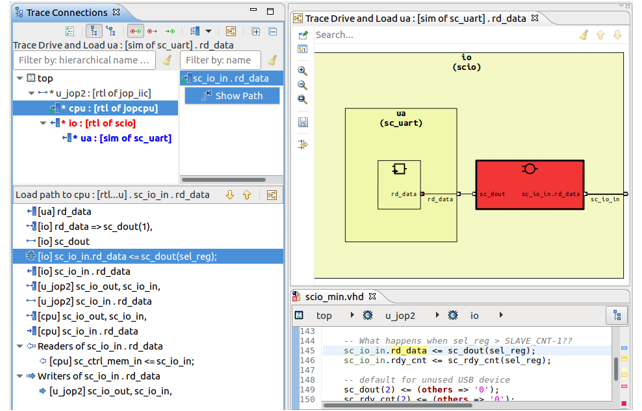
In Figure 7, the user is selecting the option to show the entire path for a signal. The IDE displays a list with the step-by-step path starting with the connected signal and ending with the traced signal. The list contains the signal declarations, instance port connections, and assignment statements through which the traced signal propagates. The writers and readers of the connected signal are shown next to it. The user can change the list order and easily navigate up and down the list. The items in the path list are linked with the source code; clicking them jumps to the code at an appropriate point. With the simple press of a button the user can generate a diagram which helps visualize how the traced signal is propagated across the design.
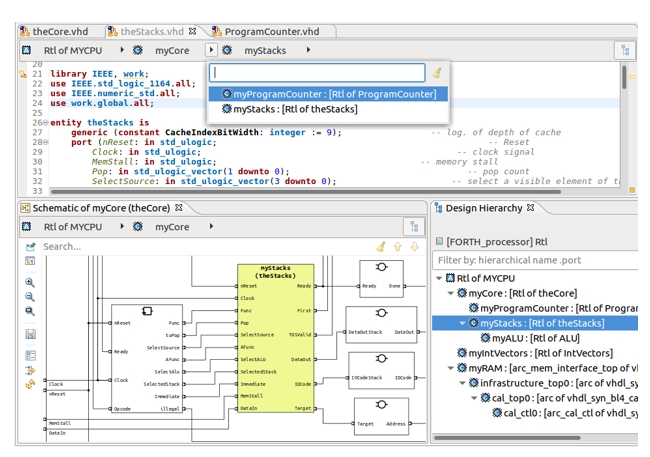
Breadcrumbs are another GUI feature in the IDE that is useful for users exploring the design and testbench hierarchy. The hierarchical path from the design top to the current design element, is clearly presented either in the editor or in diagrams, as shown in Figure 8.
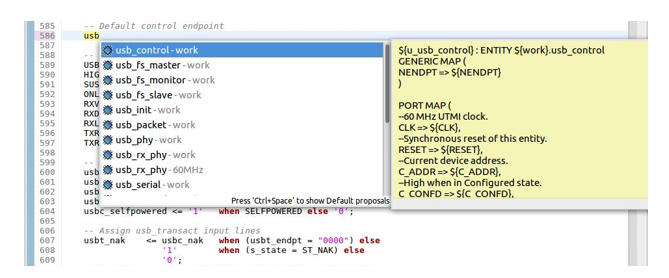
Moving, tracing, and searching across multiple VHDL files is a great benefit when debugging errors or trying to understand an inherited design. When writing new code or modifying existing code, the IDE provides several very helpful features. Perhaps the most common assist provided by the IDE is auto-completion of the name of an identifier that exists within the design or verification code. The user needs to type in only the first three letters of an entity, architecture, configuration, variable, signal, constant, function, procedure, etc. The IDE then provides a list of context-aware auto-completions. Unlike plain text editor string completion, the IDE shows only legal, semantically correct completion proposals. This makes use of its deep knowledge of the code, improving both speed and accuracy over text editors. In Figure 9, the user has entered a partial name and then selected the first item in the list. The tool proposes port mappings to instantiate the entity in the code.
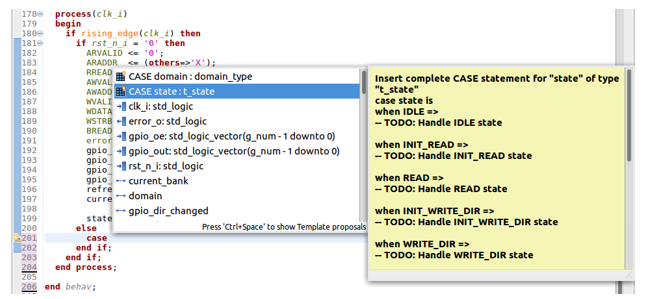
The auto-completion features apply to constructs in the VHDL language as well as user identifiers. The IDE also supplies code templates for the user to fill in. Figure 10 shows a template for a ‘case’ statement, with ‘when’ branches for all enumerated values automatically filled in by the tool, using ‘TODO’ comments to designate the portions that need to be completed by the user.
The IDE provides a set of global code templates, and it is possible to customize these templates on a per-company or per-project basis, or even to define entirely new code templates. The user needs to provide information including the template name, the template description, variables, and the context relevant to the template.
Conclusion
Design and verification engineers, like all computer users, have become used to tools that navigate easily using hyperlinks, provide sophisticated search functionality, include auto-complete features to fill in missing information when possible, and provide templates. The IDE described in this article makes these same capabilities available for the demanding process of entering, verifying, and debugging VHDL-based semiconductor designs. The learning curve is minimal with the intuitive GUI, and the IDE makes both new and experienced users much more efficient. Using an IDE for design and verification is essential for any modern chip development project.
Further reading
This article is the ninth in a 12-part series providing a comprehensive and detailed analysis of the value and deployment of IDEs. You can access all the other parts by following the links below, presented in order of publication. You can also learn more about the Eclipse IDE from AMIQ EDA by following this link.
- Why hyperlinks are essential for HDL debugging
- A helping hand for design and verification
- Correct design and verification coding errors as you type
- Take advantage of the automated refactoring of design and verification code
- Delivering on the advanced refactoring of design and verification code
- Achieving the interactive development of low-power designs
- Accelerating the adoption of portable stimulus
- Accelerate your UVM adoption and usage with an IDE
- VHDL users also deserve efficient design and verification
- How IDEs enable the ‘shift left’ for VHDL
- Extract benefit from the automated refactoring of VHDL code
- e language users deserve IDE support too
 Tom Anderson is a technical marketing consultant working with multiple EDA vendors, including Agnisys. His previous roles have included vice president of marketing at Breker Verification Systems, vice president of applications engineering at 0-In Design Automation, vice president of engineering at IP pioneer Virtual Chips, group director of product management at Cadence, and director of technical marketing at Synopsys.