Validating on-chip variation: Is your library’s LVF data correct?
Machine learning techniques help ensure the validity of Liberty Variation Format information for OCV analysis at lower process nodes.
Introduction
On-chip variation (OCV) is a major factor contributing to higher design complexity at smaller process nodes. For standard cells, I/O cells, and memory/custom cells, the effects of OCV are seen on timing characteristics such as input-to-output delay time, output transition time, and timing constraints such as setup and hold time for sequential cells. These measurements are used directly for static timing analysis (STA) calculations, and failing to accurately capture the OCV effects directly impacts the accuracy and correctness of STA-based flows. OCV effects impact process nodes as large as 130/90nm, but are more pronounced at 20/22nm and below, where timing and power characteristics of actual silicon may differ significantly from those measured via simulation if OCV effects are ignored.
Using the Liberty Variation Format to specify on-chip variation
OCV effects are modelled as random variation. OCV has a relatively small impact at larger process nodes (e.g., 130/90nm) and can be modelled using a single derating value per cell (or even per design). More granularity is required as lower process nodes. For example, from 65nm to 28nm, OCV can be captured using Advanced OCV (AOCV), which specifies a 1D table with derating factors per timing path depth.
At yet smaller process nodes, such as 20/22nm and below, OCV is modelled using the Liberty Variation Format (LVF). Today, LVF is the most accurate method of specifying OCV. An early and late sigma value is specified for every input slew/output capacitance load, for every timing arc in the cell, and for each process/voltage/temperature (PVT) corner. The ability to specify different sigma values per table entry and per timing arc greatly increases accuracy when applying random variation to the design. Recent additions to LVF include support for asymmetric or non-Gaussian distributions by the inclusion of statistical moments (standard deviation, skewness, and non-centered mean values). These additions allow LVF to continue supporting the latest design and process technology-driven OCV specification requirements.
At the smallest production process nodes (7nm/10nm), the effect of OCV on the final timing and power values can range from 50% to more than 100%. An accurate methodology for capturing OCV effects is therefore necessary to ensure the final design meets timing and power specifications.
Runtime challenges
Liberty Variation Format modeling requires significantly more simulations compared to producing only base (nominal value) Liberty models. In order to achieve 3-sigma reliability, every table value (each slew-load, timing arc, and PVT combination) would require thousands of Monte Carlo simulations if a brute-force approach was used. Modern libraries have upwards of 10M-100M slew-load, timing arc, cell, and PVT combinations, resulting in more than 100 billion brute-force Monte Carlo simulations required to generate the LVF data. This problem is compounded for larger designs such as memories, where obtaining even one LVF table value becomes problematic due to the large number of transistors in a memory critical path. Because of the magnitude of simulations required, the brute-force Monte Carlo approach is impractical for LVF modeling.
Various methods attempt to reduce LVF modeling runtime by simplifying the netlist and reducing the number of simulations required to measure 3-sigma values. Sensitivity-based methods (instead of brute-force Monte Carlo), optimization methods such as netlist reduction, and interpolation between LVF table data values are other methods in use today. With these cost-saving measures, library teams still face a significant schedule cost equivalent to 2X-5X of nominal library characterization runtime. For example, if nominal library characterization takes two weeks of runtime, another four to 10 weeks are required to complete LVF characterization.
The cost of speed
Given the high schedule cost of delivering Liberty Variation Format results, it is no surprise that runtime optimizations have become a practical necessity. Achieving high accuracy for LVF results compared to brute-force Monte Carlo is critical, but a tradeoff exists between faster runtimes and more accurate LVF results. Depending on the usage parameters and tolerance criteria, optimization techniques introduce approximations that may result in LVF models that fail to meet production accuracy standards.
In the same way that inaccurate or incorrect nominal Liberty values result in garbage-in, garbage-out STA for downstream tools, incorrect or inaccurate LVF values also directly impact quality and accuracy of the STA results. However, validating LVF data values is significantly harder than validating nominal values. Since the value obtained through 3-sigma Monte Carlo is the gold standard for comparison, significant runtime (for thousands of simulations) is required just to validate a single LVF sigma value. Validating an entire PVT or library of LVF results would be a near impossible task using traditional or brute-force validation methods.
Validating Liberty Variation Format data accuracy
The Solido team, now part of Mentor, a Siemens Business, has a closed-loop approach that enables comprehensive validation of Liberty Variation Format data, using Machine Learning Characterization Suite (MLChar) Analytics and Variation Designer’s PVTMC Verifier.
MLChar Analytics takes a data-driven approach to validating LVF results. Static rule-based checks are unreliable and may fail to detect outliers, especially for statistical measurements such as LVF sigma values. MLChar Analytics is able to determine the expected LVF sigma value for every table entry by constructing a machine-learning model of LVF values using all available PVT corners.
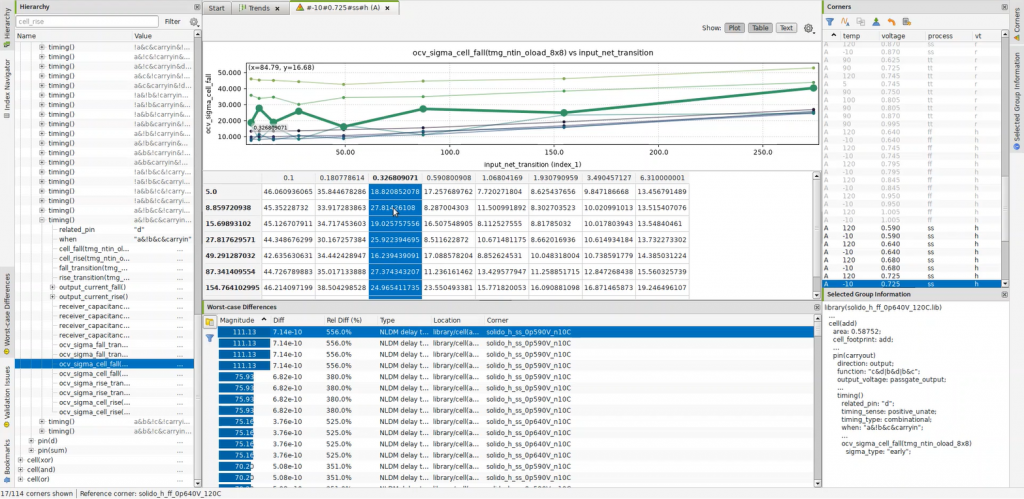
After MLChar Analytics analyzes LVF data in a library, the outlier LVF values are collected and summarized for the user in order of severity (Figure 1).

Figure 1. Machine learning-enabled outlier analysis for cell fall delay LVF sigma values in MLChar Analytics (Mentor – click to enlarge)
In addition to analyzing LVF data for outliers within .LIB OCV sigma tables, another powerful feature of MLChar Analytics is the ability to validate LVF results simultaneously across multiple PVT variants. This is useful for detecting issues in entire batches of characterized data that may not be identifiable by traditional validation methods looking at one Liberty file at a time.
As an example, the two graphs in Figure 2 show cell-delay sigma values that fit within expected semiconductor behavior (graph left) compared to cell-delay sigma values that point towards problems in characterization, as can be seen by sharp changes and outliers in the LVF data across voltages (graph right).

Figure 2. MLChar Analytics graphs showing characterized LVF cell delay sigma values across different PVTs (Mentor – click to enlarge)
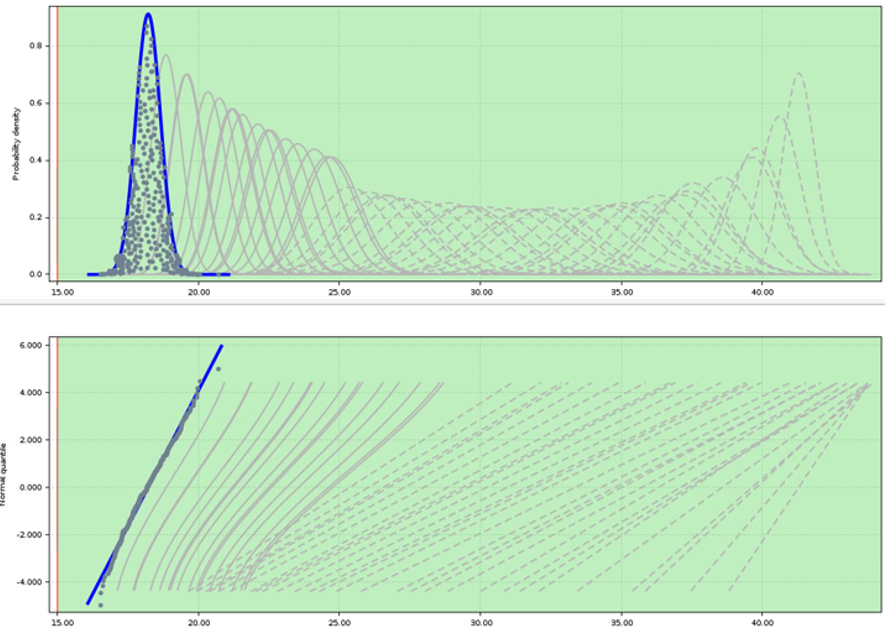
When outliers in LVF data are found, PVTMC Verifier is used to re-validate LVF values, thus completing the closed-loop, comprehensive method that ensures all sigma values in the LVF file are indeed correct. PVTMC Verifier provides fast and comprehensive Monte Carlo verification over a given range of PVT corners (Figure 3). This is ideal for process node libraries that require LVF data to be characterized over multiple PVT corners. PVTMC Verifier achieves accuracy equivalent to running brute-force Monte Carlo, but with 100X fewer simulations, and works on 3-sigma and higher sigma targets.

Figure 3. Probability densities (top) and normal quantiles (bottom) shown in PVTMC Verifier. Each curve represents a different input slew/output load/extraction/PVT corner combination (Mentor – click to enlarge)
Conclusion
Variation modeling for 20/22nm and smaller process technologies requires a high degree of accuracy due to the significant impact of OCV effects at these process nodes. Library teams have standardized on using the Liberty Variation Format (LVF) to specify OCV information for these process nodes. The brute-force Monte Carlo approach requires a prohibitive number of simulations to generate LVF data targeted for 3-sigma. Therefore, various runtime optimization methods are utilized to characterize LVF data within production schedules.
The accuracy of LVF data is critical to maintain, especially since runtime optimizations introduce additional error to the characterization flow. Due to the statistical nature of LVF data and the high number of Monte Carlo simulations required to verify each LVF data point, a complete validation of LVF data is nearly impossible to achieve using traditional, brute-force methods.
Mentor’s Solido Variation Designer PVTMC Verifier and Machine Learning Characterization Suite (MLChar) Analytics tools aim to provide a comprehensive solution for validating LVF data. MLChar Analytics provides a data-driven analysis using a machine-learning model that detects outliers in the target LVF results, while PVTMC Verifier provides detailed verification of selected LVF data points, with brute-force Monte Carlo accuracy while using 100X fewer simulations. Together, these tools form a closed-loop verification method that ensures comprehensive validation of LVF data.
More information is available on this analog/mixed-signal verification page.