Debugging with virtual prototypes – Part Three
This part illustrates the technique using examples addressing memory corruption, multicore systems and cache coherency with particular reference to watchpoints.
To read Part One, which provides an introduction to core techniques for virtual prototypes, click here.
To read Part Two, which illustrates virtual prototype tools and techniques using the example of Linux bring-up on an ARM-based SoC, click here.
Earlier installments in this series have discussed how virtual prototypes offer software access watchpoints on peripheral registers, hardware watchpoints on signals, and internal registers. The first example in this article shows how a combination of watchpoints and virtual prototype debug callbacks can be used to ensure the utilization and management of heap memory. It goes on to consider scenarios addressing multicore systems and cache coherency.
Detecting heap memory corruption using software assertions
It’s always messy when a kernel reports sporadic panic problems. The issue is largely non-deterministic and always seems to happen at different times. Typically, the program counter has been set to an invalid program address. This triggers a pre-fetch abort or leads the system to attempt to access memory that is not mapped by the MMU. Initial analysis, using a debugger and tracing, will often identify an illegal function or data pointer as the root cause. Or even worse, the stack will seem to be corrupted and linked to an incorrect register (return address). Thus, data in memory seems to get corrupted at some point. No matter whether it is an important kernel data structure or simply the function stack, tracing these defects to their root causes is a nightmare.
Here is a helpful virtual prototyping strategy for debugging and asserting heap memory corruption in the kernel space. Other than in the user space, there are barely any traditional tools available for this purpose. This is because the kernel is the closest layer to the underlying hardware. When an instruction reads or writes from memory, there is no smart layer in-between the instruction and the memory where you can assert the correctness of the access with regard to allocated or unallocated memory regions. This is what tools such as the open-source Valgrind [http://www.valgrind.org] are doing for user-space memory debugging.
Assuming we have a working basic kernel with correctly configured MMU, caches and memory map (problems with these usually have earlier symptoms and require different debug strategies), this issue typically throws out three error types in places such as custom drivers:
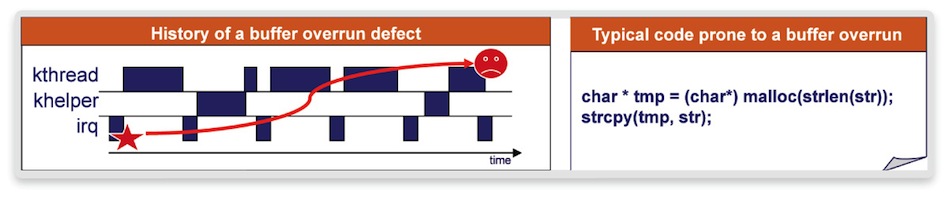
Figure 1 Memory corruption cause and delayed symptom (Source: Synopsys)
Especially in the kernel, such bugs open the door to hacks. Many persist in software stacks within devices sold to millions of users. A typical fault occurs where a zero-terminated string is copied into another buffer. That buffer is often not large enough to cope because the zero-termination character was not considered during allocation. If the text data can be influenced by user input, it is an open door for a hacker as he is able to overwrite content in memory beyond the allocated string. We need to increase confidence in the kernel with regard to heap memory buffer overrun during kernel or driver development.
In principle, the virtual prototype-based solution is simple. We go to the Linux Simple-List-Of-Blocks (Slob) Allocator and put a breakpoint on the function responsible for heap memory allocation, ‘slob_page_alloc’, as shown in Figure 1 above. We then attach a virtual prototype debug callback procedure to that breakpoint.
The callback reads the address and size parameters of the function call. Based on those, it then sets a write access watchpoint at the end of the allocated area. When doing a ‘free’ or a further allocation, we also take care to remove or reset the respective virtual prototype watchpoints.
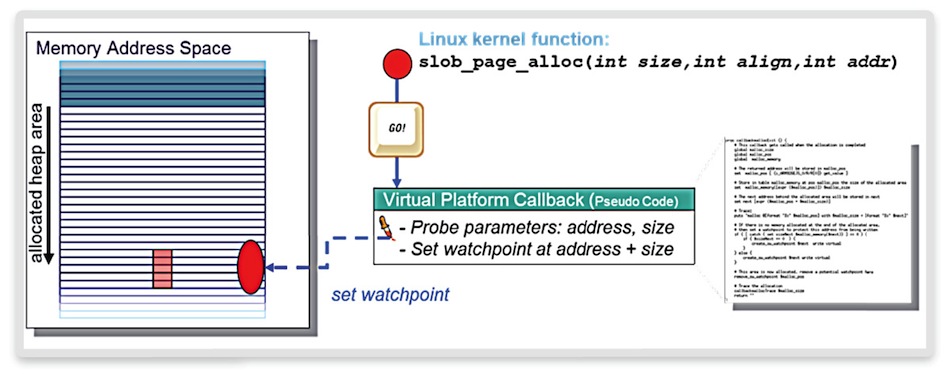
Figure 2 Scripting for heap memory assertion (Source: Synopsys)
Figure 2 shows the strategy. Alongside the assertion of memory accesses, we trace heap memory consumption over time. The virtual prototype has suspended the operation at some point due to an illegal heap memory access. By connecting a debugger, we can immediately get the location in the kernel source code responsible for the access. Here, we can see that a string copy function (‘strcpy’) copies a string from the source buffer, ‘name’, into a destination buffer, ‘newname’. However, the destination buffer is too small. The zero-termination character was not considered during buffer allocation.
This is an easy, pragmatic solution that will catch 80% of such bugs. But it does not catch every corner case. To do that, we need to implement a more conservative solution in our virtual prototype by asserting each memory access and comparing it with the kernel heap memory allocation data structure using virtual platform scripting.
If this problem had gone undetected at the point where it was triggered, the string would have been corrupted by the next initialization of an allocated area.
This is merely an illustration. For a similarly misallocated data structure containing function pointers – as typically happens for drivers – the consequences could have been much more severe.
A virtual prototype allows us to take advantage of an inspection layer between any kind of software and the hardware to assert these problems. Even for kernel code, the virtual prototype serves as a kind of virtual machine layer that performs intelligent fault checking. This layer has the advantages of full visibility into the software and hardware and the ability to intercept any (inter-) action within the software or hardware to perform user-defined validity checks.
This lazy heap memory check is just one simple illustration of this capability. There are many other use models driven by the characteristics of embedded software.
Asserting shared memory communication in a multicore system
Tracking down illegal memory accesses can lead to endless debug. This is particularly true when we are looking to integrate multiple software stacks on multiple subsystems of a platform while communication takes place via shared memory.
“While bringing up my OS on a subsystem, other parts of the system stopped functioning at some point.”
This lament will sound familiar to anyone who has worked with asymmetric multiprocessing (AMP) software and platforms. Here, a domain refers to an autonomous software stack on a specific subsystem that may interact with another autonomous software stack on another subsystem.
Virtual prototype watchpoints on peripherals or memory regions logically belong to a specific domain. But they can still be structured to catch illegal accesses from other domains in the system.
Here, a watch region is tied to a specific core. In Figure 3, the system is halted only when core A accesses a peripheral of domain B, but not if core B is performing the access. This illustrates a fundamental quality of virtual prototypes. Other than just tracing or asserting accesses to memories, the technique can determine their initiators, independent of the bus protocol.
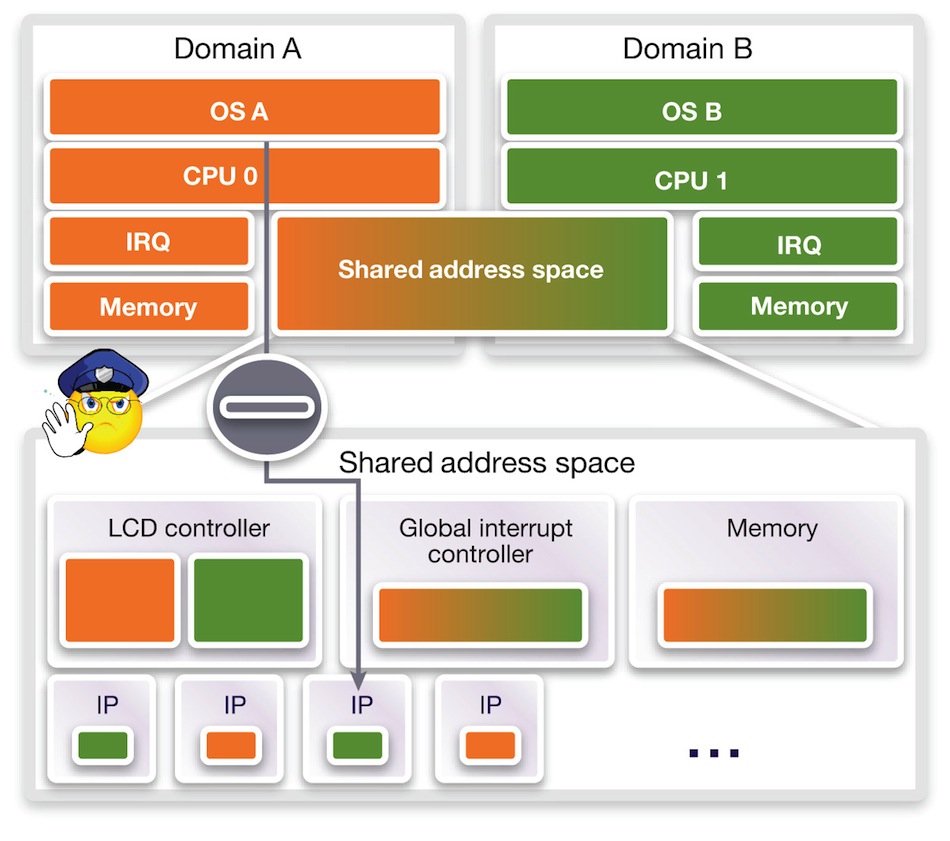
Figure 3 Multicore watchpoints (Source: Synopsys)
You might believe that even for modern protocols such as AXI, the mapping of transaction IDs to initiators is not straightforward and requires dedicated debug support in the hardware. But this capability is instantly available with virtual prototypes. It is of tremendous value for debugging shared memory that is simultaneously accessed by parallel programs on multiple cores.
However, static watch regions are insufficient where dynamic data structures are used for the exchange of data via shared memory. The next example of an implementation shows a virtual prototyping strategy that scales to such complex and dynamic shared-memory communication.
The prototype in Figure 4 has two subsystems. One, shown in orange, runs a Linux OS with an H.264 stream driver. The second, shown in green, runs H.264 decoder firmware. The Linux H.264 stream driver sends the raw video stream to the decoder firmware. The data is exchanged using a circular buffer data structure that resides in shared memory. The empty region of this buffer (orange) is for the driver to provide new data. The second (green) is for the decoder firmware to read data.
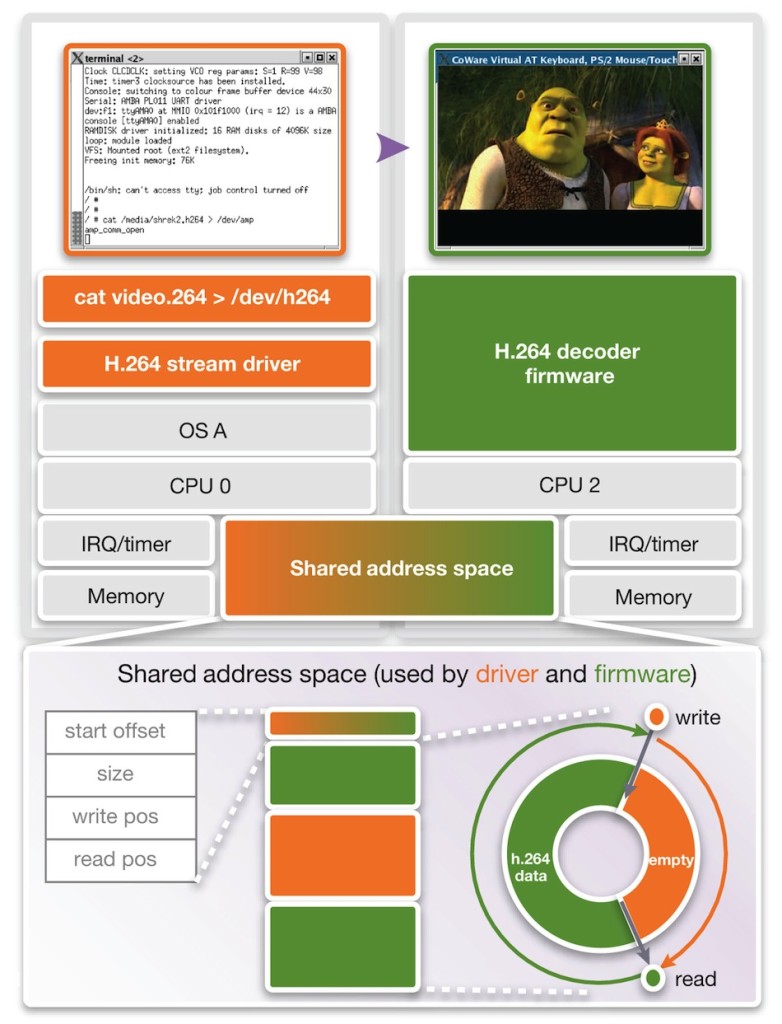
Figure 4 Driver and firmware in a multicore system (Source: Synopsys)
Control and synchronization between the two software stacks is achieved using mutexes and these are woken up by interrupts. However, within the control and synchronization between the two cores, there is a real risk that hidden race conditions will lead to an illegal access to the circular buffer. Such problems often go undetected during development because they do not lead to functional errors but do reduce video quality.
A virtual prototype allows us to observe the correct operation of the shared memory communication and we can then assert illegal accesses to the circular buffer data structure. In this case, we set a watchpoint on regions that we want to protect. That means we protect the empty region from a read access by CPU 2, and we have the data region protected by a write access of CPU 0. However, the watchpoints cannot remain static. With every read and write, they must be adjusted. We use a virtual prototype debug callback procedure that is triggered by a watchpoint on addresses in shared memory that hold the circular buffer pointers. Whenever these pointers change, the circular buffer watch regions are automatically readjusted. If a CPU now performs an illegal access, execution is immediately suspended.
This simple mechanism allows for the assertion of complex dynamic communication in shared memory. In contrast with pure software assertions, the virtual prototype scripting capability allows us to take a bird’s eye view and assert the interaction between multiple software stacks. This strategy significantly reduces the risk of defects being identified late in a project, and maybe even slipping into a final product.
Symmetric multiprocessing (SMP) and cache coherency
Let’s stay in the multicore world but now address problems associated with symmetric multiprocessing (SMP). SMP operating system (OS) bring-up is challenging. Brand-new SoC architectures are meeting brand-new OS ports.
For an SMP OS, such as Linux, the OS abstracts the platform hardware away from the application software. The OS must efficiently schedule processes among the CPUs of the platform.
A huge issue with such architectures is the coherency of data in the memory. When a process starts execution on CPU 0 it may continue later on CPU 1. A snoop control hardware unit is typically responsible for making sure that the locally cached data on CPU 0 also finds its way to CPU 1 (Figure 5). The complexity of the cache coherency becomes particularly evident in big.LITTLE processing systems from ARM (the subject of a future article in this series). There, two heterogeneous (Cortex-A7 and Cortex-A15) SMP CPU clusters must maintain coherency.
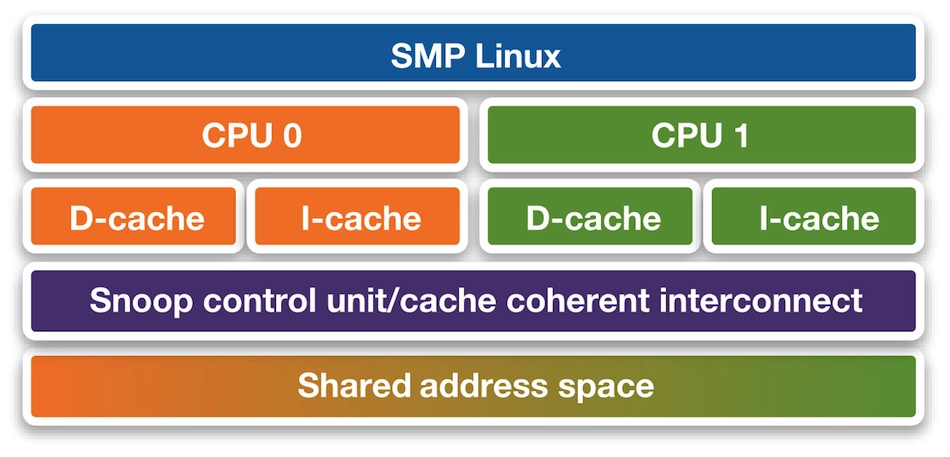
Figure 5 Symmetric multiprocessing (source: Synopsys)
In this scenario, the system is based on an ARM11 quad-core platform and the Linux 2.6 kernel. This is an older platform but serves well to illustrate how virtual prototypes help to debug cache-coherency problems. Specifically, our virtual prototype is used to spot a bug sleeping in the Linux kernel.
We first encounter a familiar symptom. Boot-up seems to hang just as the first user space process, ‘INIT’ is about to be launched by the kernel. We conduct an initial analysis using Linux context tracing.
The context traces of both CPUs in Figure 6 show CPU 1 launching INIT as expected. However, zooming in on its execution shows that INIT frequently seems to trigger data-abort exceptions (accesses to unmapped memory). We now investigate this in more detail.
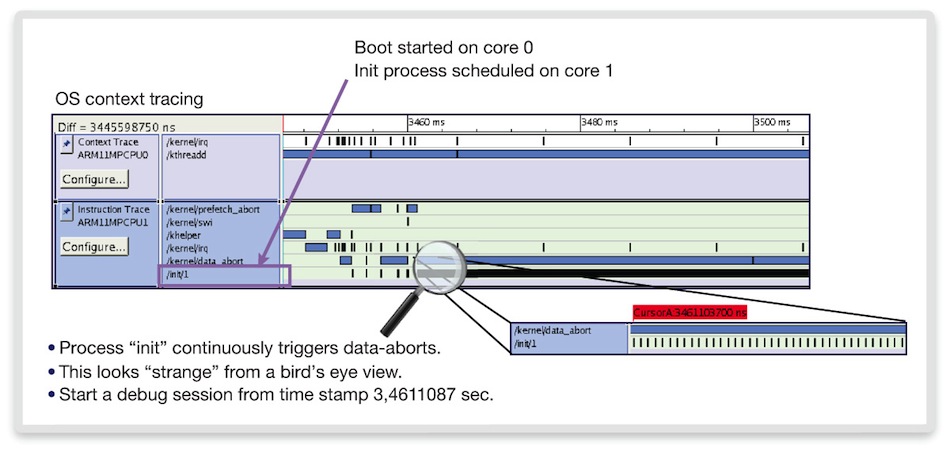
Figure 6 SMP Linux process tracing (Source: Synopsys)
We note the time right before a data-abort is 3.4s and set a time breakpoint. Since the scenarios in virtual prototypes are deterministic and repeatable, we can reproduce the same problem repeatedly at the exact same time after starting the system. After we have executed the boot-up to the point of interest, we observe it in the disassembly window (Figure 7, left). We see that only NOPs (no operations) are executed on CPU 1. This looks suspicious: why would someone put so many do-nothing instructions into a program? This leads us to examine the program code within the executable object file of the INIT program. For the address we are executing, the disassembly of the executable object file (Figure 7, right) looks very different from what we are currently executing.
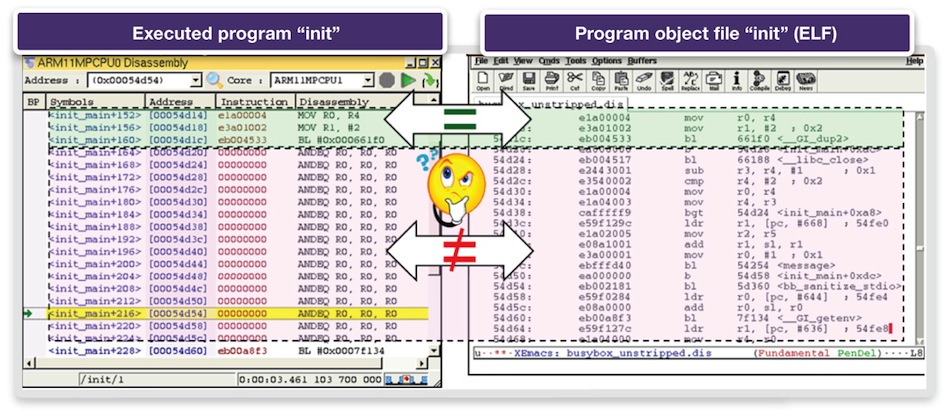
Figure 7 Disassembly – loaded program vs. object file (Source: Synopsys)
We now examine the executed instructions (Figure 7, left). It seems that a whole block of instructions is not being loaded correctly into memory, although other parts of the program are, as highlighted in green. Since the virtual prototype provides full visibility into the caches, we can see that the respective program data for CPU 1 is still in the cache of CPU 0. We therefore conclude that the memory is not coherent. The contents of the CPU 0 cache have not been written back and are yet to be used by CPU 1.
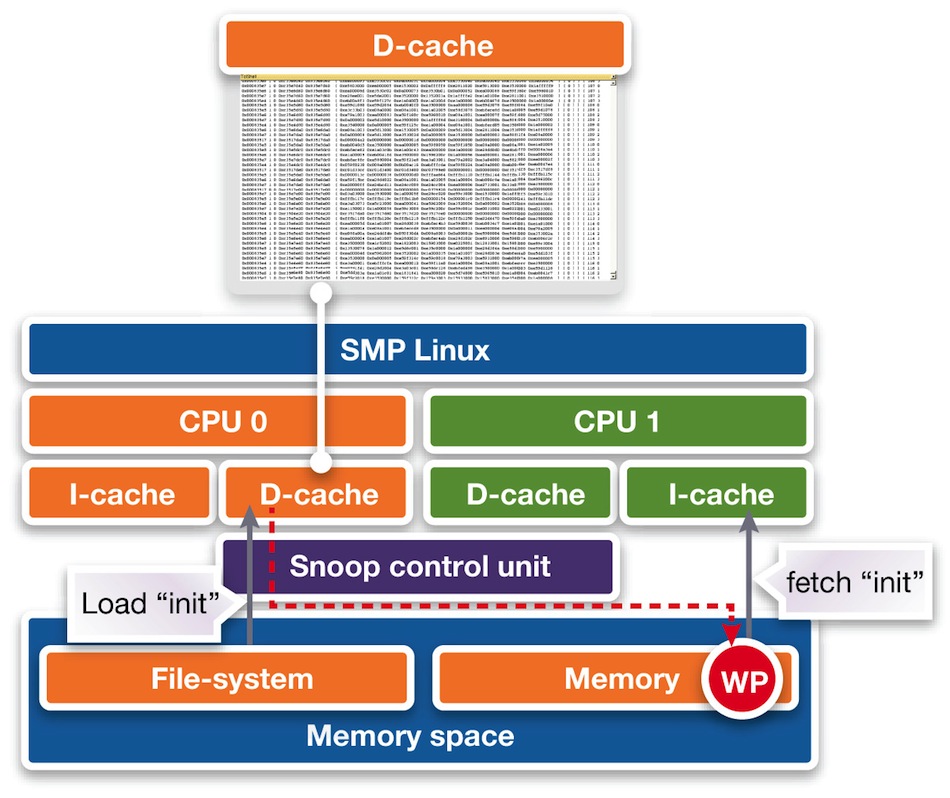
Figure 8 Cache debugging (Source: Synopsys)
The root cause is that the snoop control unit of the ARM11 MPCore does not ensure coherency for instruction fetching (Figure 8). This bug is really in the kernel and can be worked around by flushing the cache after loading programs. Typically one is not triggered, as DMAs are usually responsible for program loads instead of CPUs.
Having reviewed this example, an interesting further exercise is to consider the example shown in this web posting from the Spinics board [http://www.spinics.net/lists/arm-kernel/msg60193.html]. How and when would you debug this using physical hardware?
Conclusion
Any emerging design technique must fulfill a number of objectives. It must make the process quicker, at least. It should also provide features that are otherwise unavailable and evolve with new silicon architectures and technologies.
The three case studies presented in this article address all of those objectives for virtual prototypes. The technique makes it easier to find and resolve bugs earlier, preventing those that might harm performance or provide open doors for hackers from making it into a product release. It also boasts a set of watchpoints and other tools that can be used to get results early and efficiently. Finally, we have demonstrated the usefulness of virtual prototyping in the multicore age.
We stay with multicore for the fourth article in this series, which considers the use of virtual prototypes in the context of an ARM big.LITTLE implementation, reflecting the growing use of this architecture in the embedded space.
Further virtual prototype information and earlier installments
This article is adapted in part from a white paper entitled Debugging Embedded Software Using Virtual Prototypes
Part One: An introduction to core techniques for virtual prototypes – click here.
Part Two: An illustration of virtual prototype tools and techniques using the example of Linux bring-up on an ARM-based SoC – click here.
Author
Achim Nohl is a solution architect at Synopsys, responsible for virtual prototypes in the context of software development and verification. Achim holds a diploma degree in Electrical Engineering from the Institute for Integrated Signal Processing Systems at the Aachen University of Technology, Germany. Before joining Synopsys, Achim worked in various engineering and marketing roles for LISATek and CoWare. Achim also writes the blog Virtual Prototyping Tales on Embedded.com.
Company info
Synopsys Corporate Headquarters 700 East Middlefield Road Mountain View, CA 94043 (650) 584-5000 (800) 541-7737 www.synopsys.comSign up for more
If this was useful to you, why not make sure you’re getting our regular digests of Tech Design Forum’s technical content? Register and receive our newsletter free.
