Debugging with virtual prototypes – Part One
The first in a series of articles about using virtual prototyping techniques to achieve more effective debug.
This is the first of a series of articles on using virtual prototyping to debug embedded software. The articles that follow will focus on case studies that illustrate both techniques and advantages.
To set the scene, this article reviews the main challenges in software debug and the context in which virtual prototypes (VPs) can be used. The sections are as follows:
To read Part Two, which provides more detail on virtual prototyping tools and techniques using the example of Linux bring-up on an ARM-based system, click here.
To read Part Three, which illustrates the technique using examples addressing memory corruption, multicore systems and cache coherency with particular reference to watchpoints, click here.
Debug basics
Debugging refers to the process of removing defects, which may have been introduced by changing, porting, or writing new code. More than 50% of embedded software projects are enhancements or improvements of earlier or existing projects.
The process has four phases:
- Trigger the defect
- Become aware of the defect (symptom)
- Analyze the root cause
- Reproduce the scenario
A successful, analytic and predictable debug process must have three fundamental characteristics:
- Determinism
- Control
- Visibility
The idea is to reliably trigger debug scenarios in an environment you can manage and control, and then observe the results in enough detail to quickly identify any problems.
It can be difficult to achieve determinism, control and visibility at once, depending on the point at which you are undertaking debug. Sometimes, they are mutually exclusive.
Traditional debugging solutions have difficulty scaling with the increasing complexity of the underlying hardware and software. Engineers can end up resorting to brute force trial-and-error strategies (often known as ‘fighting the symptom’). Even then, the bugs these techniques suppress can reappear once the device is in production.
VPs overcome many drawbacks associated with debug using physical hardware.
Virtual prototypes: the basics
A virtual prototype (VP) simulates the functional behavior of a system on the software developer’s host machine. It embeds a CPU model that simulates the exact instruction-set architecture (ISA) of the target CPU, and provides the same system memory map to the software as the physical hardware. The interrupt, reset, clock connectivity of a VP matches that of the hardware.
The VP can therefore run the same binary software images that will run on the target hardware, but typically up to 12 months before hardware is ready.
Software developers use the same tools and configurations to build images for the VP as they would for the physical hardware.
A popular misconception is that VPs cost too much and take too long to create. This is only true if they are built without a particular use in mind.
For embedded software development, a VP could be assembled from functional models of the system components that are relevant to software development. Creating a VP on which to test device driver development will take much less effort than creating one to test the bring-up of an OS.
Similarly, different stages in software development often only require partial VPs, which can be incrementally assembled as a project advances.
Synopsys provides a set of reference VPs, so called VDKs, that can be used out-of-the-box, as part of its Virtualizer Toolset. Models can be obtained from commercial TLM-2.0 model libraries, such as the Synopsys TLM library, or created using dedicated model authoring tools for custom hardware. They can also be written by the software development team.
For more details about VP creation click here.
VPs: debug
VPs offer non-intrusive but deterministic debug. Control, visibility and determinism are guaranteed for all modeled components. Models of peripherals and CPUs simulate the exact behavior of the real hardware.
Synopsys Virtualizer-based prototypes integrate into almost all common third-party debug tools. The developer doesn’t have to change habits or work flows.
The software debugger is connected to an instantly available debug server provided by the VP. No special hardware and software debug infrastructure is needed. All control operations – e.g., inspection, step, run, stop – are handled by the debug server.
On hitting a watchpoint on an interrupt signal, all clocks are synchronously stopped, all timers are stopped, and watchdogs do not time out. At that point, the developer can get a deep and consistent view of the state of the hardware and software.
When the execution is continued from the suspension, the software will not know that it has been stopped for debugging.
There are two key modes in which debug can be run on VPs, each offering different benefits and meeting different usage scenarios.
‘Stop-mode’ and ‘Run-mode’
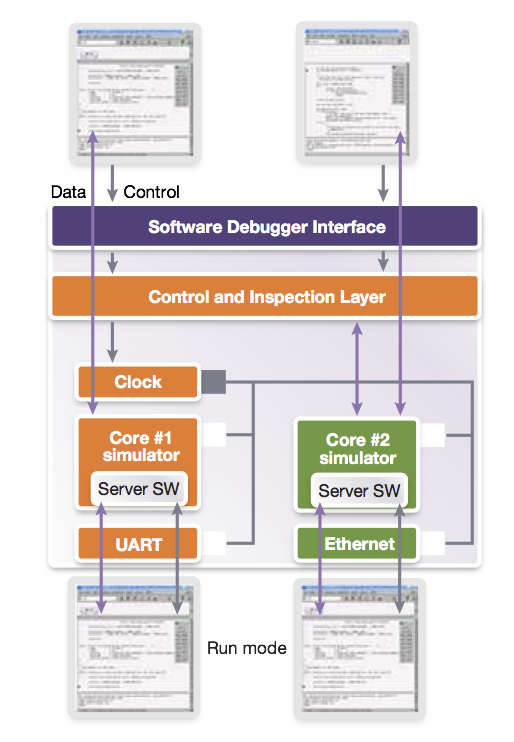
The inbuilt debug server provides instant ‘stop-mode’ connectivity to third-party debug tools, including ARM’s DS-5/RVDS, Lauterbach’s TRACE32, and GNU’s gdb.
Any other debugger that connects to a hardware target can connect to a VP using virtual I/O in ‘run-mode’. This is how the EclipseSDK for Android can connect to the Android-Debug-Bridge (adb) software daemon.
Figure 1 Synchronous operation of multiple debuggers enabled by the VP debug server (Source: Synopsys)
Stop-mode
For ‘stop-mode’ debugging, the VP ensures synchronous control of the entire system. When execution is suspended by one software debugger, the system time is frozen from the perspective of the embedded software.
This mode is non-intrusive. The software cannot recognize that the system has been halted for the purpose of debugging. As noted, no timers expire and a consistent non-transient system state is available to the developer.
The synchronous operation of multiple debuggers is also ensured by the VP debug server (Figure 1).
In a multicore system, on hitting a breakpoint in the software for CPU 1, a debugger connected to CPU 2 suspends operation until the debugger for CPU 1 resumes. This enables a very fluent source-level debugging for parallel software, because operations such as ‘continue until breakpoint’ are not cancelled by a rival debugger.
In stop-mode, a debugger can be connected or disconnected at any point during the execution of the software.
Run-mode
‘Run-mode’ debug is mostly used at the application/process level. A debug server application runs on the embedded OS and communicates with a debugger on the host via a standard interface such as UART, USB or Ethernet.
In this mode, when a process under debug is suspended, the action applies only to that process; the rest of the system continues to function.
This greatly simplifies the coupling of VPs with IDEs and SDKs because the same standard interfaces are used by the VP and the physical hardware.
VP-based debug in practice
Here are two case studies that highlight how these approaches work in practice.
Checking sensor firmware
The sensor device driver on an application processor communicates via shared memory and interrupts with a sensor subsystem. The sensor subsystem has a microcontroller core and runs the sensor firmware.
Typically, device driver developers have treated this kind of sensor subsystem as a black box and based their implementations on the various sensor programmers’ manuals. This approach was fine as long as typical sensor firmware was stable and bug free, which is no longer always the case.
Subsystems today are co-developed and integrated as early as possible to meet project schedules and are often based on preliminary firmware.
A VP can be useful here when debugging the underlying hardware-software and software-software interfaces. It raises the level of debug observation and control to the system level, giving the developer an overview of the whole system.
This turns the sensor subsystem from a black box into a white box in which communication between the application processor driver and the microcontroller sensor firmware can be clearly observed.
A stop-mode approach can scale to a whole system and debugging can be instantly performed on each CPU, no matter where it is located.
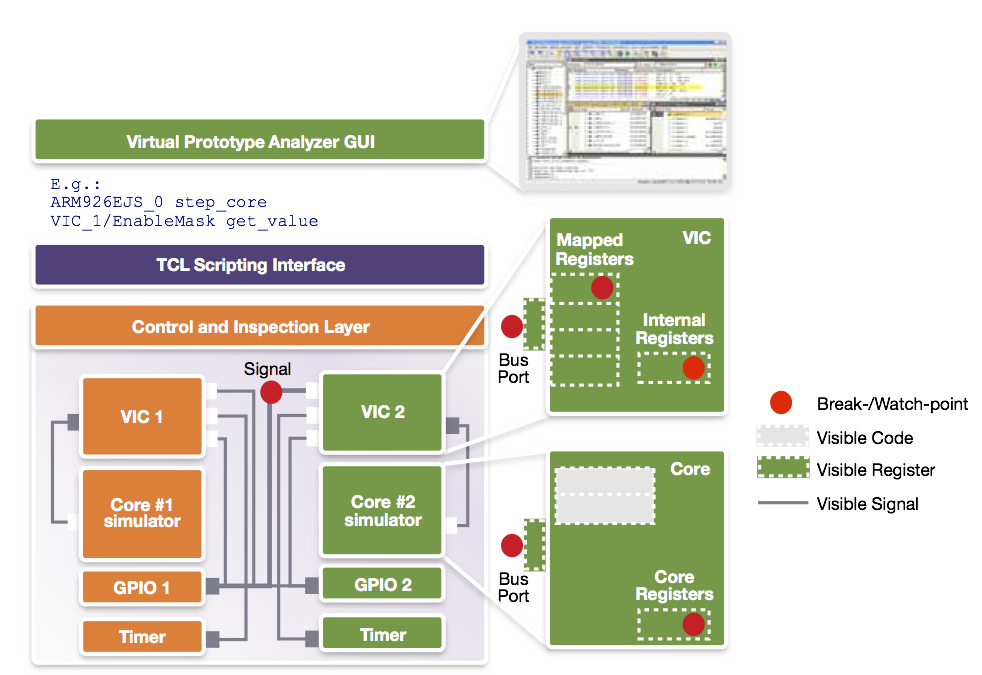
The inspection of the system can be performed using a graphical user interface or via command line. A command line approach allows for the creation of scripts that observe the system and even inject stimuli when needed. In Figure 2, a script is used to create an assertion for communication between the application CPU and the sensor subsystem.
Figure 2 Virtual prototype control and visibility (Source: Synopsys)
First, a watchpoint is set on the IRQ signal going into the sensor. This is the trigger point at which developers want to start interactive debugging of the sensor firmware. However, they may also put a watchpoint on the data register of the inter-processor communication module (IPCM) that communicates between the sensor and the application processor.
Checking inter-processor communications
In this second case, the goal is not to debug interactively, but to check automatically that the IPCM is configured correctly so that interrupts are generated for the sensor. This is done by registering a callback action to the watchpoint on the IPCM data register.
This example shows how scripting enabled by a VP enables developers to realize very powerful solutions for debugging, testing and analysis.
Using the debugger, software developers will validate the state of the system. Once they have determined that it is not running according to specification, the first question is, “What is going wrong?” Once that is clarified, the next question is, “Why is it going wrong?”
“What is going wrong” is a tough question to answer. Device driver debug can be hard to understand from a system standpoint: the driver may be stuck somewhere in the overall system execution, making it difficult to know both what went wrong and where.
Managing trace data
A debugger will enable the developer to observe a multitude of threads scheduled and executed by the kernel. If the user can step back from debugging the exact implementation to get a more global view of system behavior, it may be easier to see that, for example, the driver kernel thread is trapped in a mutex (mutually exclusive state) and waiting for an interrupt (e.g. the ‘acknowledge’ interrupt of the sensor in our previous example).
VPs provide almost unlimited tracing capabilities. In essence, every signal, register, memory or CPU program flow can be traced. This alone may not be very helpful, because it creates a wealth of trace data to be managed and analyzed.
When using a VP, smarter tracing can be achieved through user-defined monitors. These provide system or software-context awareness and result in a more abstract and easier-to-understand view.
For example, the OS state can be derived from the information stored in memory or CPU registers to trace threads or activities in higher SW layers such as Android.
Models inside a VP expose much more information about their internal state than typically observable via the registers and signals. As an example, our sensor can expose that it does not process an interrupt because voltage and frequency settings of the sensor are out of bounds.
This saves significant time when finding and fixing bugs.
VPs give users access to functionality so that they can express and then observe system events and also the capability to inspect all hardware and software.
Further information and other installments
This article is adapted in part from a white paper entitled Debugging Embedded Software Using Virtual Prototypes.
Part Two: An illustration of virtual prototyping tools and techniques using the example of Linux bring-up on an ARM-based system – click here.
Part Three: Case studies illustrating virtual prototyping using examples that address memory corruption, multicore systems and cache coherency with particular reference to watchpoints – click here.
Author
Achim Nohl is a solution architect at Synopsys, responsible for virtual prototypes in the context of software development and verification. Achim holds a diploma degree in Electrical Engineering from the Institute for Integrated Signal Processing Systems at the Aachen University of Technology, Germany. Before joining Synopsys, Achim worked in various engineering and marketing roles for LISATek and CoWare. Achim also writes the blog Virtual Prototyping Tales on Embedded.com.

