Debugging with virtual prototypes – Part Two
The second part of our series illustrates VP tools and techniques using the familiar example of Linux bring-up on an ARM-based SoC.
To read Part One, which provides an introduction to core techniques for virtual prototypes, click here.
To read Part Three, which illustrates the technique using examples addressing memory corruption, multicore systems and cache coherency with particular reference to watchpoints, click here.
Linux is complex and continuously evolving. It provides a driver model that allows user-space applications to access the underlying hardware. But porting or developing drivers is complex and drivers often need to be adapted to new kernel releases.
The kernel is a large body of code with many interacting entities such as low level architecture specific code, multiple privilege modes, scheduling, power and thermal management, driver frameworks, network stacks, file systems, runtime configuration etc. Just understanding how the kernel is working is a challenge. If things go wrong, it can extremely difficult to identify the cause. Virtual prototyping can help overcome many of these intrinsic difficulties.
This article considers how to use virtual prototypes to overcome problems encountered in a simple but realistic example: bringing up a Linux-based board support package (BSP) on an ARM SoC.
Basic bring up
The developer begins by downloading the kernel sources, and then configuring the kernel according to platform HW specification using a so called flattened device tree (FDT) configuration file.
After building the kernel image, the compressed kernel (zImage) and the boot loader are put into the flash memories of a virtual prototype. The Linux kernel boot sequence begins and shows a promising “Uncompressing Linux…” message on the serial console terminal connected to the UART. The boot loader appears to have executed correctly and launched the kernel decompression routine.
However, no matter how long we wait the console does not show the expected boot process log.
Debug begins with virtual prototypes
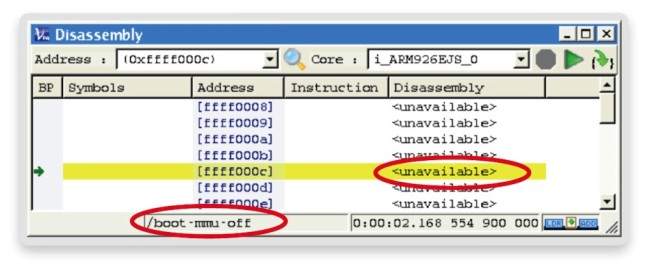
The first task is to find out what has worked, what has not, and what is happening now. It is easy to assess the current state by evaluating the program counter of the core. Using the disassembly view of the Synopsys virtual prototype analyzer, or a connected 3rd party debugger, this can be accessed instantly (Figure 1).
Figure 1 Disassembly (Source: Synopsys)
The program counter points to the address 0xffff000c. The kernel is within the phase ‘boot- mmu-off’. In this initial phase the MMU of the processor is still turned off and the kernel is going through some very basic initialization and checks. We try to advance the execution using the step button, but the program’s address does not change.
Assuming some experience with ARM cores, this suggests we are trapped in the processor’s exception handler for an undefined instruction. Let’s try to determine what is happening within the system purely from information provided by the virtual prototype.
The only conclusion, without prior knowledge (often the case for porting) is that we are trapped where no program code is available (‘<unavailable>’) at the address to which the counter points.
This gives us a helpful tip for using virtual prototypes. You can expose information without setting up dedicated debugging infrastructure (e.g., a kernel debugger). Visibility into processor registers and program code is instantly available.
Virtual prototypes and software tracing
A virtual prototype can expose much more than just the current processor state. It can also show how the processor reached that state.
Without requiring special hardware (trace modules) or software instrumentation, virtual prototypes can provide a trace of the execution history at the required levels of abstraction for efficient debugging.
Figure 2 shows two levels of trace abstraction. In the upper row, the process (OS context) trace indicates that the processor went from the decompression phase into the boot phase while the MMU was still turned off. The bottom area shows specific functions executed during the boot.
We can already see that functions such as the processor or machine type look-up have executed successfully (no error handler triggered).
Figure 2 Context and function trace (Source: Synopsys)
The last function call is ‘__turn_mmu_on’. To determine why the boot process does not execute any further functions, we require a more detailed analysis of this function and zoom into the related time region.
After placing the cursor into the function, a more detailed instruction-level trace shows a program branch from 0x00008074 to 0xc0008148. Here, the MMU seems to get turned on, as addresses change from physical to virtual (Linux kernel virtual addresses typically have ‘0xc’ or ‘0xb’ in the upper four bits). However, the instruction at the virtual address 0xc0008148 is not valid, as shown by the more detailed instruction trace in Figure 3.
An invalid instruction means data at that address has not been decoded as a processor instruction, resulting in a prefetch abort. In 32bit, ARM-based Linux, the prefetch abort handler is located at the address 0xffff000c, as observed earlier.
Figure 3 Function and instruction trace (Source: Synopsys)
The visibility provided by virtual prototypes at the needed levels of abstraction (operating system context level, function level, instruction level) clarifies what is going wrong in a couple of minutes. The boot is being caught in the prefetch abort handler via the routine that should turn on the MMU. Finding out how a program reached the point at which it exhibits a symptom is typically the most difficult and time-consuming part of debug, and often remains unanswered due to a lack of traceability. This leads to lengthy and expensive guess-and-experiment debug.
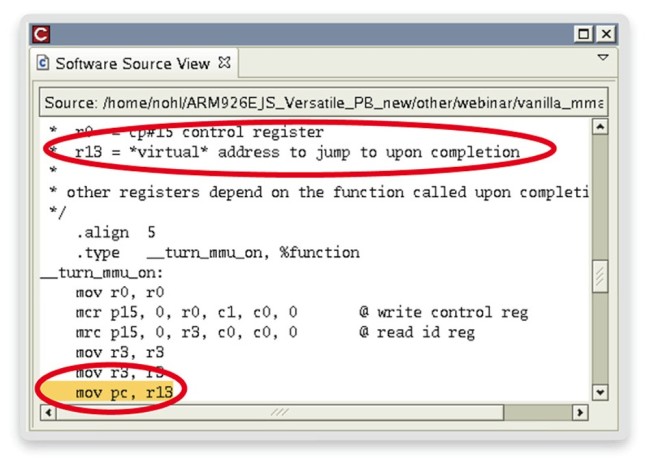
We still need to understand why things are going wrong. Examining the relevant source code is a helpful first step, since it (should) contain written comments about intentions. In the virtual prototype environment, source code corresponding to the current time-cursor can be opened instantly (Figure 4).
The comments say that the routine intends to jump to a virtual address. This is happening, according to the instruction trace. What is not clear is why the instruction at that address is illegal. What does the memory contain? To find out, we need to find and inspect the physical memory to which this virtual address is mapped by the MMU. Is the mapping correct? What data is at the address?
Figure 4 Source code link (Source: Synopsys)
MMU visibility
Each model for virtual prototypes uses a set of tool extensions. For the ARM core used here, functions are provided to inspect the state of the processor memory subsystem. These retrieve the content of the caches, TLBs, and the mapping of the MMU. Here is the relevant code:
i_ARM926EJS_0> mmu_show i_ARM926EJS_0

Iterate MMU

|

+-0x30004000 [ 0 - fffff ] -- virtual: [ 0 - fffff ]

+-0x30007000 [ 30000000 - 300fffff ] -- virtual: [ c0000000 - c00fffff ]
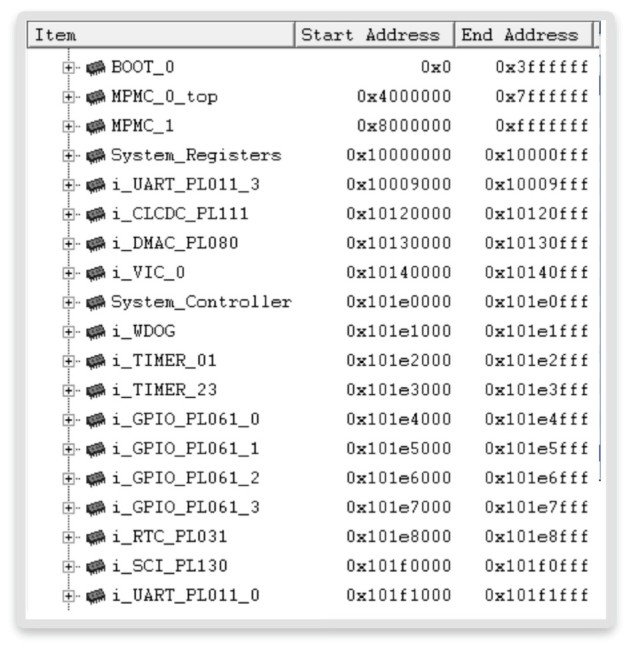
All commands in the Synopsys virtual prototypes solution can also be invoked from the TCL-based scripting console. The command ‘mmu_show’ shows the current virtual-to-physical address mapping done by the ARM MMU. In this case, the address 0xc0008148 is mapped to the physical memory at the bus address 0x30008148. Inspecting the bus address memory map of our prototype (Figure 5) allows us to check the correctness of this mapping.
Figure 5 SoC memory map (Source: Synopsys)
In fact, we would not expect this mapping as our RAM is located at address 0x0 and not 0x30000000. This means our Linux kernel is configured with the wrong offset for the physical DRAM.
This is how efficient and analytical debugging can be with virtual prototypes. Especially during the early phases of boot-up, many debugging solutions lack visibility and traceability since the required software tracing and debugging functions are not yet operational. This leads to time-consuming trial-and-error debugging.
Virtual prototypes provide all the necessary details (visibility) at the right level of abstraction to enable thorough top-down analysis, rather than guesswork, which makes debugging much more predictable. But our system isn’t ready yet.
Low-level peripherals and drivers
After correcting the memory configuration, we rebuild the kernel, restart the boot – and observe the same symptom as before. This time the problem seems to be at a different location. We are trapped at a new, yet unknown, location.
It is often thought, wrongly, that since none of the verbose kernel messages can be seen, they are not executed. In fact, those messages can only be delivered via the UART to the console terminal once the UART driver is fully operational, and many other services have to be set up (e.g., the MMU, timer, interrupt controller, etc.) before this can happen.
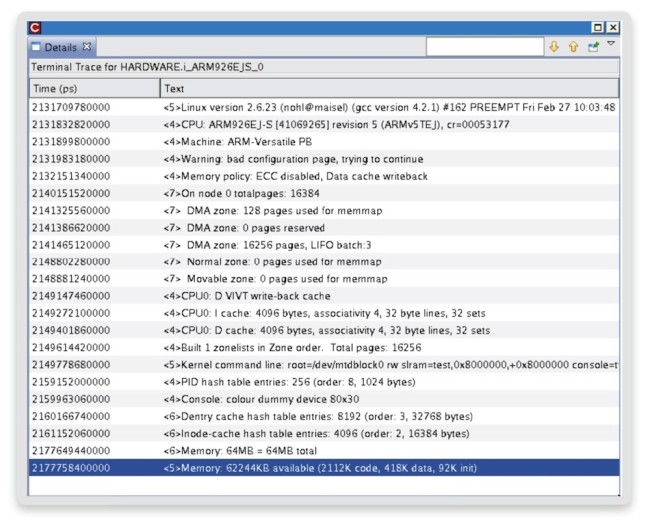
Virtual prototypes can display kernel messages before the UART driver is functional, which may provide valuable hints about the problem.
A log of the kernel debug messages issued by the kernel and cached by the virtual prototype is shown in Figure 6.
Figure 6 Kernel debug message tracing (Source: Synopsys)
Virtual prototype scripting for embedded software inspection
The kernel debug message print function ‘printk’ calls ‘void emit_log_ char(charc)’ which prints a single character of a formatted string. Whenever this function is called in the kernel, we can read out and trace the character argument.
We do not want to do that manually by setting a breakpoint at a function and noting the resulting value. With virtual prototypes, we can automate the task by using the debug scripting interface without changing the kernel software.
Within virtual prototypes, a breakpoint can trigger a callback debug action (in the virtual prototype tools framework, not in the embedded software). Such actions inspect the state of the hardware and software, and read out registers, memories or even signals using a scriptable API. In our case, whenever ‘emit_log_ char’ is executed, the breakpoint triggers a callback debug procedure that reads the argument from the CPU register R0 and prints it to the scripting console. The TCL kernel-debug message trace script is implemented in 6 lines of code:
 # 1: Set a breakpoint at emit_log_char

set bp [ create_breakpoint “emit_log_char” ]

# 1: Attach a callback procedure

$bp set_callback tcl_emit_log_char

# 3: Implement the callback procedure

proc tcl_emit_log_char {} {

# 4: Get the character from the CPU register

set c [ {i_ARM926EJS_0/R/R[0]} get_value ]

# 5: Print the character to the debug console

puts -nonewline “[format “%c” $c]”
}
Triggering virtual prototype debug procedures by breakpoints or watchpoints enables the creation of non-intrusive (i.e., without influencing or modifying the state or execution flow) software-aware tracing monitors for assertion, debugging or performance measurement.
With the TCL scripting API, the user has full access to all registers and memory contents of the system. Valuable tools such as ‘strace’ (system call trace) can be implemented and executed before the OS allows user-space applications to run.
In our example, the kernel debug messages allowed us to confirm which functions during the boot have been completed successfully. However, as often happens with debugging, the log did not contain any hint as to what the problem could be. We need to investigate further.
Kernel-level software and peripheral debugging
Virtual prototypes have low-level capabilities for debugging the hardware-dependent software layer by exposing details of the underlying hardware that the user typically cannot see.
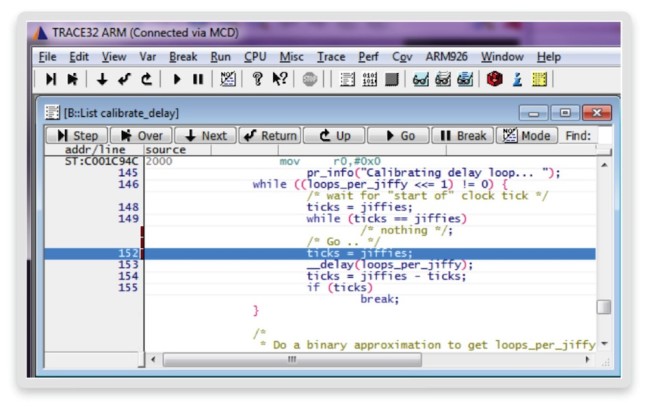
Combining assembly level debugging of the virtual prototype with a simple breakpoint, we have found that we are stuck in an endless loop. We now connect a software debugger (here, the Lauterbach TRACE32) to explore and understand what prevents the kernel from moving forward (Figure 7).
Figure 7 Kernel level software debugging (Source: Synopsys)
Note here that the software developer is working in a debug environment with which he is familiar. This means that virtual prototypes are non-disruptive and complementary to existing debug flows, as well as offering additional tools and better control of the debugging target than real hardware.
The debugger operates in ‘stop-mode’: the entire system is suspended. Thus, the software will not be able to tell that it has been halted since all timers and clocks are suspended as well. The debugger shows the execution being trapped in a while loop.
This loop is waiting for an internal counter (ticks) to become different from its initialized value (jiffies). However, the loop itself does not modify the counter. Another OS process must be responsible for changing the state and reaching the exit condition.
Looking at the source code comments, we see that the loop waits for the start of a clock tick. The clock tick should be signaled through the timer interrupt service routine, but this is not happening. We derive that information from a keyword search (grep) on the kernel sources.
We need to find out why the tick is not signaled. This can have various root causes. The timer interrupt service routine might be defective, it may not be registered at the interrupt, or the timer peripheral may not work at all. There is plenty of room for speculation and time-consuming experiments, but the virtual prototype helps us focus.
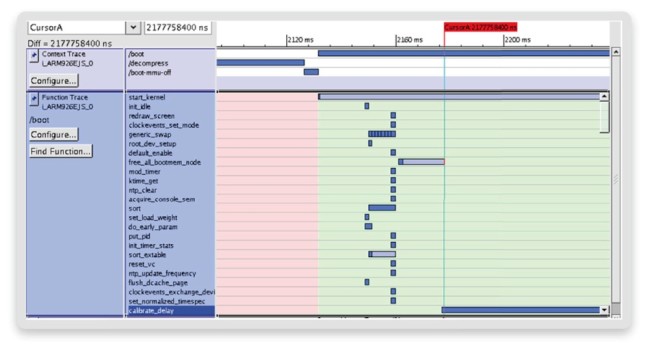
First, we can confirm that no interrupt is handled by the kernel. We draw this conclusion from the Linux operating context tracing log (Figure 8). Here, an interrupt handling would be visible as an additional row in the context trace for the interrupt handler.
Figure 8 Kernel thread and function tracing (Source: Synopsys)
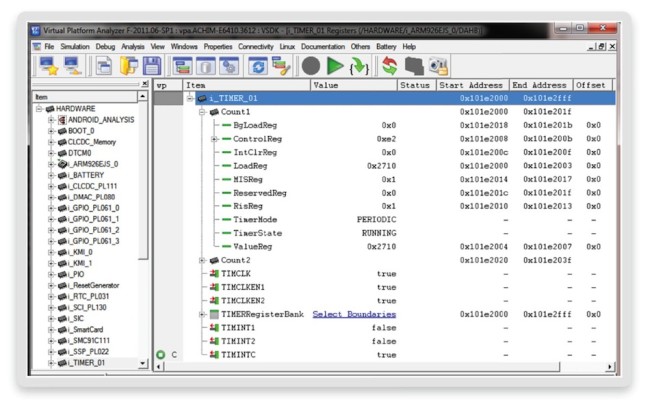
We now ask whether the timer is working and signaling interrupts at all. The answer can be easily obtained using virtual prototypes because we can inspect the usually hidden internals of the timer peripheral (Figure 9).
Figure 9 Timer peripheral debugging (Source: Synopsys)
After putting a signal watchpoint on the timer interrupt signal, we quickly confirm that interrupts are being issued. Furthermore, the timer model exposes information about the mode and the state. The timer is programmed correctly as it can be seen in periodic, running mode. Such detail is again typically hidden.
We can therefore conclude that the problem is not in the timer, but in the chain between the timer and the core: the interrupt controller.
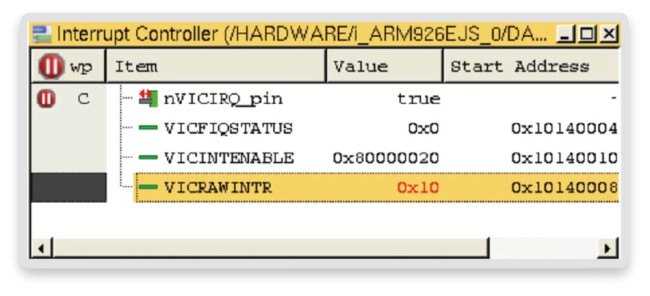
We need to find out what the interrupt controller is doing with the timer interrupts. Using our virtual prototype, we expose interrupt controller signals and registers (Figure 10).
Figure 10 Interrupt controller status (Source: Synopsys)
By investigating the interrupt controller registers, we see that the timer interrupt 0x10 (0x10 = 0b10000, bit 4 is set translates to interrupt line 4) is received via the RAW interrupt register VICRAWINTR. However, the interrupt status-register VICFIQSTATUS remains 0. Looking at the interrupt enable mask register VICINTENABLE, we see that the timer interrupt 4 is not enabled. Otherwise it would be 0x80000030 and not 0x80000020. Thus, the enable mask is being wrongly initialized by the kernel or has been overwritten by faulty code.
Here the ability of virtual prototypes to provide visibility of the peripheral registers and signals has helped to nail down the problem in a bad interrupt controller configuration. Our ability to set watchpoints on signals provided clarity as to whether the timer was operating or not.
The state of the interrupt enable mask register could have been observed through a software debugger instead of the virtual prototype analyzer. However, without the synchronous stop of the whole system, the results would have been transient and thus meaningless.
The next task is to identify when and where in the code the wrong value is set in the interrupt enable mask register.
Spotting the problem in source code
When working with as large a code base as the Linux kernel, there are many places in the code that could cause the problem. It is hard to focus on those that access a memory location such as a memory mapped peripheral register. There may also be faulty code where it is not obvious that a specific peripheral is being accessed.
We have historically set breakpoints at dozens of places, hoping that one proves close to the problematic code. But using virtual prototypes, we can set a software access watchpoint at any physical memory address, such as the interrupt enable mask register.
Typically, watchpoints are placed on virtual memory addresses. However, in the case of physical address watchpoints, even though the MMU is wrongly configured, the system will suspend as soon as a specific core in the system is accessing the watched register.
Especially during Linux bring up, we cannot assume from the beginning that the MMU configuration of the fragmented peripheral IO space is correctly defined. The software developer may believe the timer virtual base address refers to the timer peripheral. But, in case of a bad configuration it may well point to the interrupt controller or just another timer.
With virtual prototypes, we can set a watchpoint on the interrupt enable mask register of our specific timer. The system will halt as soon as the timer is initialized, even within faulty code. We can then connect a software debugger to validate the code, as seen earlier in Figure 10.
In this scenario, we used many debug abstraction levels. We started to answer the question, “What is the problem?” using the source level debugger alongside the OS context trace. The context trace revealed that no timer interrupts were handled, which helped focus the investigation on the timer and interrupt peripheral. The ability to investigate signals and registers gave us clarity on where the interrupt was broken.
The watchpoint on the interrupt controller peripheral register led us directly to the faulty kernel code. This top-down debug flow steers the investigation in the right direction, resulting in a less speculative debugging process.
Conclusion
This case study has focused on a Linux implementation, but we will cover other technologies for virtual prototypes in future parts of this series. In our next part, we will see how a combination of watchpoints and virtual prototype debug callbacks can create powerful solutions to assert the correct utilization and management of heap memory.
Further information and other installments
This article is adapted in part from a white paper entitled Debugging Embedded Software Using Virtual Prototypes
Part One: An introduction to core techniques for virtual prototypes – click here.
Part Three: Case studies addressing memory corruption, multicore systems and cache coherency with particular reference to the use of watchpoints – click here.
Author
Achim Nohl is a solution architect at Synopsys, responsible for virtual prototypes in the context of software development and verification. Achim holds a diploma degree in Electrical Engineering from the Institute for Integrated Signal Processing Systems at the Aachen University of Technology, Germany. Before joining Synopsys, Achim worked in various engineering and marketing roles for LISATek and CoWare. Achim also writes the blog Virtual Prototyping Tales on Embedded.com.
