Using DFM for competitive advantage
The article offers a case study of the DFM planning and methodology applied during a shrink of Cambridge Silicon Radio’s UF6000 system-on-chip from the 130nm to 65nm.
The UF6000 chip offers embedded 802.11 b/g and Wi-Fi, and therefore includes a significant analog/RF portion, circuitry that is not typically covered in detail by the rule decks foundries provide. CSR therefore had to develop much of the flow itself, in partnership with its EDA vendor. The company set five goals for the work:
- Put the design infrastructure in place and debug ahead of designers’ needs.
- Get a foundry technology aligned to CSR’s needs and requirements.
- Hit volume manufacturing without affecting functionality and performance targets.
- Ramp production to volume on time, with no manufacturing surprises.
- Enable subsequent reuse of in-house intellectual property in application-specific standard products.
The challenges of production at advanced process geometries are well known. EDA companies and foundries have been developing and perfecting design-for-manufacturing (DFM) technology in anticipation of users’ critical needs. However, many designers have so far viewed these DFM tools with skepticism because they have continued to get products to market without them.
Two factors are influencing the use of DFM for IC development at 65nm and below. First, foundries now require or strongly recommend DFM checks, essentially equating them to traditional design rule checks (DRCs). This requirement implies a shift in responsibility—customers who do not run DFM checks during design verification may find their foundries are less willing to address yield issues when their products ramp to volume. Second, some companies have discovered that DFM can provide competitive advantages, and are therefore aggressively deploying it to wring more performance out of and/or increase the reliability of their designs at advanced process nodes.
Cambridge Silicon Radio (CSR), a leading supplier of wireless system-on-chips (SoCs) for the mobile communications industry, is one company that has recognized the competitive value of DFM. It is actively employing DFM-related tools and technologies to ensure high-yield manufacturing of its high-performance analog/RF silicon, while also achieving performance and die size that gives it a market advantage.
Background
CSR’s UF6000 SoC offers embedded 802.11 b/g and Wi-Fi. The project was based on placing all the functionality in the smallest, lowest cost package possible; on delivering the best possible performance and reliability; and on getting silicon to market in a timeframe that would deliver maximum profitability.
DFM for this design was a taxing process. While digital content drives the move from one node to the next, the UF6000 is not fully digital. In fact, a significant percentage of the chip area is analog/RF with multiple radios. Issues related to analog/RF are generally not captured by the foundries in rule decks, so the designer must independently apply DFM to optimize these portions of the chip.
CSR set a detailed node advancement schedule, intended to take the UF6000 design from 130nm to 65nm as quickly as possible while adding new features and optimizing performance.
DFM implementation
Foundries use production data to build generic DFM rule decks. DFM rules are meant to prevent problems from arising during layout and physical verification, before the design gets to manufacturing. When IC design companies apply these rules, their yield may be as expected. However, for an advanced or custom IC design facing intense time-to-market and cost pressures, they may not be able to afford the tighter restrictions of DFM rules if they are not optimized for specific design goals. DFM EDA tools simulate manufacturing processes and use sophisticated techniques to calculate how to best use every last nanometer of space while adhering to yield and performance goals.
To support the project’s objectives and ensure a uniform and consistent usage of DFM technology, CSR formed a small cross-functional DFM team and established targets. The four most important were:
- Put the design infrastructure in place and debug ahead of designers’ needs.
- Get a foundry technology aligned to CSR’s needs and requirements.
- Hit volume manufacturing on schedule, without affecting functionality and performance targets.
- Ramp production to volume on time, with no manufacturing surprises.
Additionally, CSR established one objective external to the UF6000 design: enable subsequent reuse of robust in-house intellectual property (IP) in application-specific standard products.
Design infrastructure
The main factors that influenced CSR’s choice of DFM technology for this project were the relationship with the technology supplier and the proven success of the selected DFM tools in real-world production. For this project, CSR partnered with Mentor Graphics to implement a variety of DFM techniques using tools based on the Calibre nmDRC platform.
The DFM technologies (and tools) used in this project were:
- Critical area analysis (Calibre YieldAnalyzer)
- Critical feature analysis (Calibre Yield-Analyzer & Calibre YieldEnhancer)
- Lithography hotspot analysis (Calibre LFD)
- Chemical-mechanical polishing analysis (Calibre CMPAnalyzer & Calibre YieldEnhancer)
Critical area analysis
Critical area analysis (CAA) identifies areas of a layout that are highly vulnerable to random particle defects because of the close spacing of layout features. A CAA rule deck is configured with the layer mappings for the design, and foundry estimates of the defect density distributions for each process and defect type (open/short).
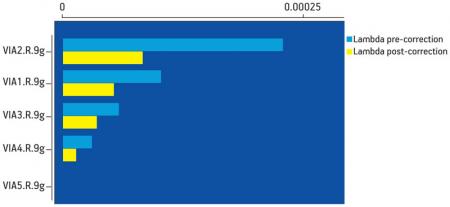
Calibre YieldAnalyzer uses this deck to perform CAA on all base and interconnect layers and calculate the amount of area in each layout layer that is susceptible to a short or open for a range of defect sizes. This distribution of critical area by defect size is produced for each layer and each defect type. These critical area distributions are then multiplied by the defect density distributions for the corresponding layer and defect type to determine the failure probability. These probabilities are used to identify random defect hotspots, or areas with the highest vulnerability, which can then be adjusted. Figure 1, p. 13 shows typical correction results.
Figure 1
Visible improvement is demonstrated after design correction
Using Calibre YieldAnalyzer, CSR performed a CAA analysis of all standard cells in the UF6000 design. Based on those results, CSR was able to identify and modify those cells with the greatest sensitivity to random manufacturing defects.
Critical feature analysis
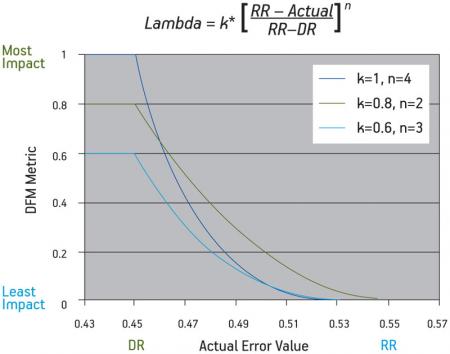
Critical feature analysis (CFA) quantifies a design’s sensitivity to a systematic issue (represented by recommended rule compliance). A CFA rule deck is configured with a list of recommended rules and estimates for weighting functions for each rule based on foundries’ recommended rule priorities. Calibre YieldAnalyzer uses this deck to generate a weighted score for each recommended rule violation. This score is reported as lambda, but is only correlated to a failure probability in a relative sense, not an absolute sense (Figure 2, p. 13). When interpreting CFA scores, a lower value for lambda represents a design that is more robust against systematic variation, while a larger value represents an increased failure probability. A higher score also indicates that a design is more sensitive to a category of recommended rules. Each of the individual error scores cumulates to the chip level to score the overall design for yield robustness.
Figure 2
Calculation of lambda, using foundry weightings for recommended rule compliance to assign criticality
Once a rule violation is identified, Calibre YieldEnhancer has the automated capability to determine the amount of correction that can be achieved. This allows the user to compare how robust a design is before and after correction. Because the tool uses only available white space to implement improvements, it does not change the fundamental layout set down by the routing tool.
CSR performed CFA analysis with Calibre YieldAnalyzer and Calibre YieldEnhancer to identify and optimize recommended rule compliance in the UF6000 chip.
Lithography hotspot analysis
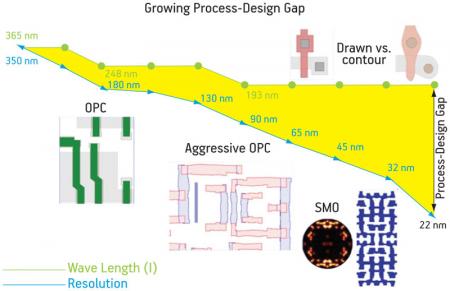
As node size has decreased, lithography has increased as a challenge for designers. Figure 3 shows the widening gap.Lithography analysis identifies layout hotspots (structures likely to fail due to lithography process variations) and grades them according to their potential for yield improvement. A foundry will provide a litho-friendly design (LFD) kit. A designer can use this to run simulations and obtain an accurate representation of a layout’s results under that foundry’s specific lithographic process. The goal is to drive the design to an ‘LFD-clean’ sign-off. With lithography hotspot analysis, designers can check designs with foundry-specific LFD verification and correct lithographic hotspots before fabrication.
Figure 3
Lithographic trend showing continuously increasing separation between process and design
CSR performed lithography hotspot analysis on the core IP complement of the UF6000, and corrected cells that showed significant lithographic sensitivity. The designers also updated layout guidelines to reduce sensitivity to hotspots.
Chemical-mechanical polishing analysis
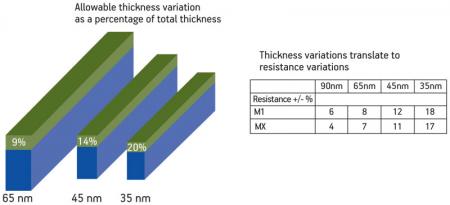
Chemical-mechanical polishing (CMP) has a direct physical effect on chip success. Model-based planarity analysis enhances systematic and parametric yield at smaller process nodes by accounting for the changes in thickness and resistance variability caused by decreasing line widths. This is particularly important because thickness variation increases as node size decreases (Figure 4). The capability to predict and minimize CMP variation in a design is crucial to achieving yield goals.
Figure 4
The percentage of total thickness variation increases at each node, making CMP variation a critical manufacturing issue
CMP simulation enables designers to examine a variety of CMP effects. This analysis can be combined with fill analysis, in order to reduce resistance variability and minimize capacitance added by the filling process.
It is crucial for the design to exhibit consistent behavior for all its core IP components (e.g., the analog/RF macro). Analyzing potential thickness variation issues across the die is imperative for the type of analog/RF SoCs that CSR produces.
Achieving tight control in thickness variation through the UF6000 design was achieved using Calibre CMPAnalyzer as the CMP simulation cockpit.
Results
CSR implemented all of the DFM technologies discussed above in the development and production of the UF6000 at 65nm. While test chips were used to prove out the technology in-house, CSR wanted demonstrable results in a full production environment to complete a full cost/benefit analysis for DFM technology.
All of the DFM tools and technologies employed identified manufacturing sensitivities in the UF6000 design that would have reduced yield, performance, or both. As a result of identifying these sensitivities, CSR was able to:
- optimize specific aspects of the CSR design flow; and
- optimize some CSR layout styles.
These changes enabled CSR to not only enhance the design of the UF6000, but also provided a foundation for other designs and nodes.
Through CSR’s proactive implementation of DFM analysis and modification, potential ‘showstopper’ hotspots and weak points were identified and corrected before tapeout. By moving design issues into the design flow, rather than waiting to identify problems during initial manufacturing, CSR significantly reduced the risk of respins.
Although more difficult to measure, the assumption can be made that the impact on time-to-market was beneficial because production was not delayed due to poor yield. Similarly, the DFM process helped ensure that the UF6000 met performance specifications.
Lessons learned
The success of CSR’s adoption of DFM had nothing to do with luck. Careful planning and a conscientious follow-through are needed to demonstrate the value of DFM. Several key factors are central to getting a positive outcome.
- Ensure design support by establishing a cross-functional DFM team within your organization. This team ensures uniform adoption and implementation of the DFM tools and technologies, and consistent problem resolution. The earlier this is put in place, the less potential rework is required.
- Establish schedule, functionality and performance targets and commit to them. Doing so enables you to determine the true impact of DFM technologies on your ability to produce working silicon.
- Document your outcomes. Demonstrating tangible results makes it easier to evaluate the worth of the process and the tools, and provides you with a roadmap for future projects and designs.
CSR would have been able to produce the UF6000 without DFM. However, by implementing a broad range of DFM technologies, they successfully reached working silicon without manufacturing surprises. CSR management was convinced that DFM enabled them to meet their time-to-market and performance goals, providing further competitive advantage.
Mark Redford is general manager of North American Operations for Cambridge Silicon Radio, Colin Thomas is a DFM technologist at the company, and Mark Scoones works on Digital Physical Design for CSR. Jean-Marie Brunet is director of DFM product marketing for Mentor Graphics.


