How critical area analysis improves yield
CAA is a valuable tool available to both design engineers and foundries to help them avoid layout-dependent effects during manufacturing.
Critical area analysis (CAA) can be used during design and verification to directly improve an IC’s manufacturability and thereby yield.
Manufacturing yield is a critical business goal for design houses and foundries. Maximizing the number of operable chips helps design companies maximize their expected return. A foundry that consistently demonstrates high yields is more likely to attract repeat and new customers. Yield is relevant to every process node, every design technology, and every market. Obtaining or exceeding your target yield is essential for success.
Theoretically, it seems logical to assume that two designs of the same size, with the same layers, will have the same yield. However, yields differ between similar designs for many different reasons. One is the presence (or absence) of layout-dependent effects — geometries in a particular configuration that create a susceptibility to defects caused by stray dust particles landing on that layout during manufacturing. Layout-dependent effects can dramatically vary yields between two otherwise comparable designs.
CAA is a form of analysis that lets designers and foundry engineers determine before manufacturing begins if a given design is likely have yield problems caused by such layout-dependent effects. Engineers can then use the CAA results as a guide to design modifications that will improve the chances of avoiding these manufacturing defects, achieving a desired yield, and ultimately improving profitability.
Defect-density data collection
The defect-density rate is unique to each manufacturing process. At its core, critical area analysis is a statistical technique that uses defect-density data provided by the foundry for a given manufacturing process to make a prediction of defect-limited yield (DLY), which is the average production yield for a given design. Obviously, for a CAA tool to accurately predict DLY, accurate defect density statistics are needed.
Each foundry has various proprietary methods for collecting defect-density data correlated to its manufacturing processes. One approach is to create test chip structures on wafers, then observe and collect the defect results from various configurations. Another is to use optical metrology — directing light beams on manufactured ICs to measure reflections from defect particles, or to compare manufactured shapes against a ‘golden’ reference shape, and then note any variations.
Test chips
For the highest accuracy, defect-density numbers must be based on manufactured wafers. The most accurate method is to design test chips, print one or more on potentially every wafer, and test them post-manufacturing. A variety of test structures are commonly used in these test chips.
Combs and snakes are used to test for open and short defects (Figure 1). Comb structures consist of interdigitated ‘fingers’ that can be used to establish the defect density for shorts on a particular layer. The fingers do not touch, and are spaced at the minimum design rule checking (DRC) spacing value, so defects appearing in this geometry generate data for the total defect density for shorts on that layer. Snakes are long zigzag structures, with one wire having a minimum width according to the DRC rules for that layer. Defects created in the snake generate data for the total density of open defects on that layer.
Because combs and snakes must be tested, they must be connected to I/O pads that allow direct measurements of continuity. Multiple structures can potentially be tested through a small number of I/O pads by using multiplexers. CAA test chips may also include combs and snakes using widths and spacings larger than the minimum DRC rule to determine the fall power (how rapidly the defect density falls with increasing defect size) in defect-density equations, but these additional structures obviously require additional area.
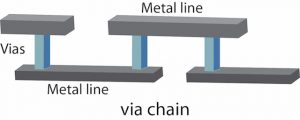
Via failure rates are measured by using very long via chains, where an array of vias on the same layer are connected in series using the metal layers above and below the via layer to make the connections (Figure 2). The metal shapes can be made wider than the minimum DRC width to reduce the possibility that a metal open will be mistaken for a via failure. However, using wider metal shapes in a via chain increases the area of the via chain.
There is a tradeoff between total test structure area and how efficiently the foundry can determine accurate defect densities. For example, if they start with the assumption that the via failure rate is approximately one failure per billion vias (1 x 10^9), they would have to print one billion vias to have a 100% chance of finding one bad one. Then, to be confident that the number is actually 1.0 x 10^9, and not 1.1 or 0.9, many more vias must be printed and tested. Defect density numbers for shorts and opens have a similar trade-off. Foundries need to collect enough test data to be confident in the results, while trying to maximize production area on the wafer.
As a result, test structures are often placed in the die scribe lines, but this approach limits the amount of data that can be collected. While scribe line structures don’t ‘rob’ the wafer of production die sites, they are often too small to collect meaningful defect density data or via failure rates. Scribe line test structures can potentially reveal differences in defect densities across the wafer, but the total area of defect-density test structures will probably be higher if a test chip covering one complete die is printed.
Because printing a full die test chip significantly speeds up the process of data collection, it is common practice for foundries to include four or five test die per wafer. The advantage of full-die test chips is that they are the most accurate method of determining defect densities, but the downside is the high cost of designing, printing, and testing them. The addition of non-minimum DRC width and spacing structures for fall-power measurement can significantly increase the size of the test chip. If the test chips are tested on production testers, this is also an added expense, since every test chip is replacing a production chip.
Optical metrology
Optical metrology is the other method commonly used to determine the density of random defects. An optical system mechanically scans the final wafer looking for reflections or surface anomalies that can be detected using light beam measurements. With optical metrology, no production die is sacrificed for test chips, and no time is spent on production test equipment. In principle then, optical metrology is cheaper, but the technique has significant limitations.
Optical metrology typically operates in one of two modes: fast or detailed. In fast mode, the entire wafer can be scanned, but at a low resolution. Detailed mode has a much higher resolution (meaning smaller defects can be detected), but not surprisingly, it takes much longer to scan the entire wafer. Detailed mode is often used to scan one or more complete production die near the center of the wafer.
Another limitation of optical metrology is that it looks for optical anomalies only—it cannot distinguish between defects causing shorts and defects causing opens. The total defect density from optical metrology is the sum of the defect densities for shorts and opens. The actual ratio of open defects to short defects will vary, depending on the process steps involved.
But perhaps the most serious limitation of optical metrology is that it is not accurate for determining single via failure rates. This is again because it only looks for optically visible defects. Via failures can be caused by issues at the bottom of the via hole that cannot be detected optically after the hole and the trench above are filled with metal and polished.
Defect-density estimation
There is one other method for calculating defect density. As an alternative to expensive test chips or incomplete data from optical metrology, you can simply estimate defect densities based on past production yields for similar designs. Fabless companies might use this approach if they cannot obtain foundry defect-density data.
Given some designs that are already in production, the designs that come closest to the ideal area-based yield prediction can be chosen as the basis for the estimated defect densities. Estimated defect densities can be tuned to match production yields, and then used to predict yields on new designs.
In converting production yields to defect densities, we use the Poisson yield model for simplicity. The basic strategy of the estimation method is to start with a production yield and invert the Poisson Yield equation to get a total value for the average number of faults (Lambda_ANF). After defect density estimation, the predicted Lambda_ANF from a CAA tool should be the same as the one calculated from the production yield.
When using estimation, the recommendation is to use area normalization such that, regardless of the design used for the estimation, the area is normalized to one square centimeter. Normalizing the area has the advantage of making all the defect density numbers have the same units (defects/sq cm). The defect-density numbers calculated by estimation can then be directly entered into the defect-density file used by a CAA tool.
Defect-density data conversion
Now that you have all this data, what do you do with it? Foundries convert their defect density data into a form compatible with the critical area analysis tools provided by EDA companies. The most common conversion format is a simple power equation, as shown in equation (1). In this equation, k is a constant derived from the density data, x is the defect size, and the exponent q is the fall power. The foundry curve-fits the opens and shorts defect data for each layer to an equation of this form to support automated CAA.
In general, a defect density should be available for every layer and defect type for which critical area will be extracted. However, in practice, layers that have the same process steps, layer thickness, and design rules typically use the same defect density values.
Defect density data may also be used in table form, where each specific defect size listed has a corresponding density value. One simplifying assumption typically used is that the defect density is assumed to be zero outside the range of defect sizes for which the foundry has data.
Critical area analysis in practice
A critical area analysis tool calculates values for the average number of faults (ANF or Lambda_ANF) and yield based on the probability of random defects that introduce an extra pattern (short) or missing pattern (open) into a layout, causing functional failures (Figure 3). The critical area, or the locations on the layout where a particle of a given size will cause a functional failure, depends entirely on the layout and defect sizes. Fill shapes are excluded from CAA, because they are nonfunctional.
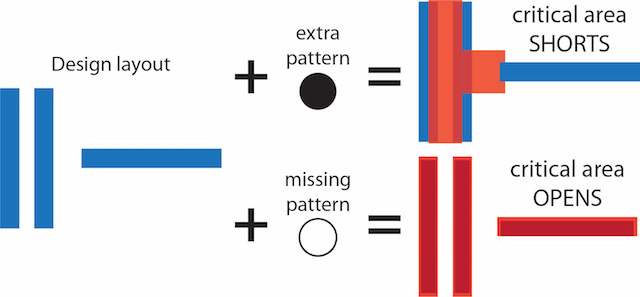
Figure 3. Definition of critical area based on extra pattern (short) and missing pattern (open) (Mentor)
Quite logically, as shown in Figure 4, critical area increases with increasing defect size. Theoretically, the entire area of the chip could be a critical area for a large enough defect size. Realistically, most foundries limit the range of defect sizes that can be simulated, based on the range of defect sizes they can detect and measure with test chips or metrology equipment.
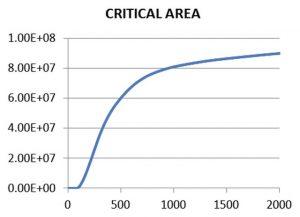
Figure 4. Critical area CA(x) in square microns as a function of defect size in nanometers for one defect type (Mentor)
In addition to shorts and opens calculations, CAA also analyzes potential via and contact failures, which often prove to be the leading failure mechanisms (Figure 5). Depending on the defect data provided by the foundry, other failure mechanisms can also be incorporated into the CAA process.
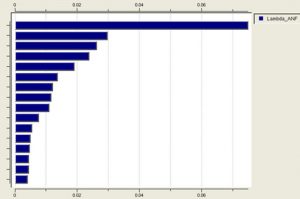
Figure 5. Pareto of ANF values for defect types in a large SoC. The dominant defect type in this analysis is contact to diffusion (Mentor)
ANF calculation
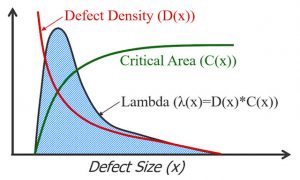
After the critical area CA(x) is extracted for each layer over the range of defect sizes, the defect density data D(x) is used to calculate ANF according to equation (2), using numerical integration. The dmin and dmax limits are the minimum and maximum defect sizes according to the defect data available for that layer.
A visual of this equation is shown in Figure 6.
In most cases, the individual ANF values may simply be added to arrive at a total ANF for all layers and defect types. You should be aware that ANF is not strictly a failure probability, as ANF is not constrained to be less than or equal to 1.
Yield calculation
Once the ANF is calculated, we apply one or more yield models to predict the defect-limited yield (DLY) of a design. The Poisson distribution yield model, shown in equation (3), is frequently used. Of course, DLY cannot account for parametric yield issues, so be careful when attempting to correlate these results to actual die yields.
Cut layers
ANF and yield calculation for cut layers (contacts and vias) is usually simpler than for other layers. Most foundries just define a probabilistic failure rate for all single vias in the design, and assume that via arrays do not fail. This simplifying assumption ignores the problem that a large enough particle will cause multiple failures, but it greatly simplifies the calculation of ANF, and reduces the amount of data the foundry must provide. With just a sum of all the single cuts on a given layer, the ANF is calculated as the product of the count and the failure rate, shown in equation (4).
Once the ANF(via) is calculated, via yield may also be calculated in a similar fashion. Regardless of which yield equation is used, total yield is always a product of the individual yields for each layer and defect type. Vias between metal layers may all use one failure rate, or different ones based on the design rules for each via layer. The contact layer can be separated into contacts to diffusion (N+ and P+ separately, or together), and contacts to poly, each with discrete failure rates.
Critical area analysis pays off
Maximizing yield is a critical business goal for both design companies and foundries. Critical area analysis enables both design and foundry engineers to determine in advance if a design is likely to have yield problems as the result of layout-dependent effects. Using foundry defect-density data, automated CAA tools enable designers to analyze their layouts and make design modifications with the confidence that those changes will improve the final yield for that design. Foundries can use the same data to continuously evaluate and optimize their manufacturing processes to reduce their defect density rates and improve their marketability. With its direct impact on manufacturability, CAA is a valuable method for improving the bottom line.
For more information, download the whitepaper “Getting started with critical area analysis”.
About the author
Simon Favre is a Technical Marketing Engineer in the Design to Silicon division at Mentor, a Siemens Business, supporting and directing improvements to the Calibre YieldAnalyzer and CMPAnalyzer products. Prior to joining Mentor, Simon worked with foundries, IDMs, and fabless semiconductor companies in the fields of library development, custom design, yield engineering, and process development. He has extensive technical knowledge in DFM, processing, custom design, ASIC design, and EDA. Simon holds BS and MS degrees from U.C. Berkeley in EECS.
