Effects of InfiniBand fixture crosstalk on a synthesized eye diagram
Introduction
A synthesized eye diagram begins with an accurate TDT measurement of a linear device. The validity of this approach has been proven across a number of case studies and is now commonly accepted in the communication industry. The measurement allows the device’s eye response to be accurately generated by an advanced synthesis algorithm such as that employed in IConnect TDR/T and VNA software. Most compliance measurements require specially designed fixtures. The synthesized eye diagram test for serial link standards is no exception. An ideal test fixture would have uncoupled signal traces up to the measurement reference plane. However, it is not always possible to design a fixture that does not exhibit any coupling between its traces before the reference plane.
When an eye diagram is measured in the presence of aggressors, coupling from the adjacent lines adds to the magnitude of the crosstalk and causes overestimation of the actual value. The eye diagram can be measured more accurately if an engineer can determine the crosstalk contribution from the fixture and then subtracting its noise contribution from the overall crosstalk measurements. IConnect measurement software has a built-in feature that allows the user to do this, and this paper outlines the correct data acquisition process to de-embed fixture crosstalk from eye diagram measurements.
Reference Plane for Interconnect Measurements
Figure 1. Cable testing measurement setup. Dashed lines indicate locations of reference planes.
When performing any measurement, an engineer may wish to obtain the device under test (DUT) characteristics only, excluding or de-embedding any effects from probes and fixtures connected to the DUT. The DUT is commonly defined by the location of the reference planes, which usually coincide with where the interconnect is positioned in the system. For example, in a cable testing assembly the reference planes are usually found just before a highspeed connector that is used to connect a cable under test as illustrated in Figure 1 (This figure replicates a real application environment where the cable would be connected to a board).
To de-embed such a fixture from the overall S-parameter measurement using time domain network analysis (TDNA), the user would measure transmission waveform (TDT) using the calibration traces, and then use the measured data as a ‘thru’ reference to de-embed effects of the fixture up to the defined reference plane. However, while this de-embedding approach is adequate for many TDNA measurements, it may not be sufficiently accurate when a synthesized eye diagram under presence of aggressors is being considered. Here, issues arise because of coupling between adjacent lines that usually exists in the fixture but which is not replicated in the calibration traces. As a result, the eye diagram measured using the conventional approach will include an overestimated crosstalk value and produce an eye with a smaller opening. This, in turn, could result in the device failing compliance test.
To accurately measure a synthesized eye diagram in the presence of aggressors, one wants to determine the amount of crosstalk that comes from the fixture alone, and then subtract it from the overall measurement. This methodology is implemented in IConnect software and explained in more details in the following sections.
Infiniband 4x fixture example
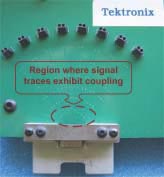
Figure 2. Gore Infiniband 4x test fixture. The differential traces become coupled at the high-speed connector receptacle area.
Consider the example of Gore Infiniband 4x fixture shown in Figure 2. The test fixture consists of differential connectors and PCB traces connected to the receptacle of a high-speed Infiniband connector. The various differential traces in this fixture become coupled at the area where they approach the high-speed connector. This coupling is not a part of the DUT and needs to be de-embedded from the eye diagram measurements.
When subtracting the fixture’s contribution from the overall crosstalk, the contribution from near-end crosstalk (NEXT) must be considered. If the far end is not terminated with matched terminations, then a part of the far-end crosstalk (FEXT) will be reflected back to the near end and will change the magnitude of the NEXT. To provide matched terminations at the reference planes, extra calibration traces are required. These traces have to replicate the measurement traces up to the reference planes and be terminated with matched terminations. For the case of 100 Ohm differential traces, 100 Ohm resistors can be used. In such a case, when the aggressor’s signal is applied, the measured NEXT value will correspond to the crosstalk that exists in the fixture. This crosstalk waveform is then used in IConnect to take into account the noise contribution from the fixture only.
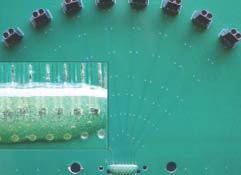
Figure 3. A crosstalk calibration fixture used to measure noise contribution from the test fixture only. Each differential trace is terminated with matched (100 Ohm) resistors. The termination area is enlarged.
To measure the crosstalk value of the test fixture alone, a replica of the test card is built. This new calibration structure allows the engineer to determine the amount of the crosstalk that comes from the fixture alone. The connector’s receptacle is replaced with matched termination resistors (100 Ohms), as illustrated in Figure 3. The purpose of placing these terminations is to minimize reflections from the far end of the fixture and produce a real application environment while setting the correct reference plane. Now, the fixture-only crosstalk value can be accurately measured and used in the eye diagram with aggressors for de-embedding.
To illustrate the validity of this approach two test cases are considered. Case 1 consists of the NEXT measurements from the crosstalk calibration fixture shown in Figure 3. Case 2 considers the NEXT measurements from the test fixture with an Infiniband connector receptacle. Since the high-speed connector exhibits additional coupling and is not terminated, it can be expected that Case 1 will measure a lower magnitude of the crosstalk than a similar measurement of Case 2.
Figure 4. Near end crosstalk (NEXT) measurement results from the test fixture with cable disconnected (red waveform, Case 2) and the calibration fixture terminated with matched resistors (green waveform, Case 1).
The measurement results shown in Figure 4 support this forecast. While the maximum magnitude of the NEXT value for the Case 1 is 1mV, the maximum magnitude of the NEXT value for the Case 2 is 3.9mV. Therefore, if the crosstalk value from the non-terminated test fixture was used to subtract the fixture’s noise contribution, the resulting eye opening would be overestimated and the amplitude of the jitter might not be accurate.
Fixture crosstalk de-embedding
Figure 5. Eye diagram measurements for the InfiniBand cable assembly with no signal applied to the aggressor lines (Case A). An eye diagram generated at 2.5Gbit/s and 80ps 20-80% rise time, shows peak jitter of 26.4ps, eye opening of 579mV and vertical noise of 166mV.
Figure 6.Eye diagram measurements for the InfiniBand cable assembly with fixture’s crosstalk included (Case B). Eye diagram generated at 2.5Gbit/s and 80ps 20-80% rise time, shows peak jitter of 62.8ps, eye opening of 554mV and vertical noise of 203mV.
Figure 7. Eye diagram measurements for the InfiniBand cable assembly with fixture’s crosstalk de-embedded incorrectly (Case C). Eye diagram generated at 2.5Gbit/s and 80ps 20-80% rise time, shows peak jitter of 63.7ps, eye opening of 567mV and vertical noise of 186mV.
Figure 8. Eye opening measurements for the InfiniBand cable assembly with fixture’s crosstalk de-embedded using a terminated calibration fixture (Case D). Eye diagram generated at 2.5Gbit/s and 80ps 20-80% rise time, shows peak jitter of 65.3ps, eye opening of 562mV and vertical noise of 194mV.
To demonstrate how the fixture crosstalk may affect the eye diagram measurements, consider this example of a 5m long InfiniBand cable assembly. The eye diagram was generated under four scenarios:
A. An eye diagram without any aggressor signal;
B. An eye diagram with aggressor signal applied to all other traces of the cable assembly but without de-embedding the fixture effects;
C. An eye diagram obtained with the fixture crosstalk de-embedded using the same fixture with the cable disconnected;
D. An eye diagram with crosstalk de-embedded using a special calibration fixture terminated with matched resistors at the reference plane.
Case A is an ‘ideal’ case when no aggressor signal is applied to the adjacent traces. It shows the best performance for a single differential pair. Cases B- D are worst case scenarios where the aggressor signals apply.
Case B is an example of what happens if no appropriate crosstalk de-embedding is performed. It can be expected to produce the largest NEXT contribution at the victim line. Case C uses crosstalk measurements obtained from the same fixture with unplugged cable and will result in the subtraction of an excessive fixture crosstalk. This is because the crosstalk of the high-speed connector is present in the fixture reference waveforms being de-embedded. Case D corresponds to the correct technique to de-embed fixture effect from the eye diagram measurement. In this case the calibration fixture is used. The results of these test measurements are shown in Figures 5-8 and summarized in Figure 9. The ‘ideal’ case is shown in Figure 5; it results in 579mV of an eye opening, 166mV of noise and 26.4ps for peak jitter. Figure 6 shows the effects of the aggressors applied at the receiver’s side of the cable assembly; no fixture’s crosstalk is deembedded in this case. The eye measurements reveal 554mV of the eye opening and 203 mV of the noise. Part of the eye closure and the noise is attributed to the fixture’s crosstalk.
Figure 7 shows results for the case when excessive crosstalk is subtracted from the overall measurements. Eye diagram readouts indicate the eye opening of 567mV and noise of 186mV. Since the amount of the fixture’s crosstalk is overestimated, the resulting eye diagram shows a more open eye than would be obtained if the reference planes were set correctly.
The most accurate results are shown in Figure 8, where the special calibration fixture shown in Figure 3 is used. The eye opening in this case is 567mV and the noise is 194mV.
Conclusion
The preferred methodology for deembedding fixture crosstalk effects from eye diagram measurements with IConnect software is described. Eye diagram measurements performed on an InfiniBand cable assembly illustrate the effects of crosstalk from adjacent lines as well as from the test fixture on a synthesized eye diagram. This technique will allow a test engineer to obtain accurate measurements of a synthesized eye diagram with a TDR oscilloscope and IConnect software.
Notes
1. “Cost-Efficient Cable Assembly Compliance Testing and Modeling,” Application Note, Tektronix Inc.,WebID: 3037
Figure 9. Summary of the results for different methods to de-embed fixture’s crosstalk from the eye diagram measurements of 5m long InfiniBand cable assembly
