How to optimize test patterns based on critical area
The world of ATPG just changed with the introduction of a new way to create and choose the most effective test patterns.
Choosing the most efficient test patterns and setting coverage targets has always been a challenge and becomes still more daunting with the addition of new types of patterns. DFT teams can spend years establishing ATPG targets—like a coverage goal, pattern size, or some other metric—just for stuck-at and transition fault models. Targets need to be adjusted for a new technology node when important new fault models are introduced. How do companies decide what targets to set? If you want to apply a sample of patterns aimed at a new fault model, which patterns are best to try?
Using newer models makes setting fault model target metrics even more complicated. When you need to add a new fault model, the target could be completely different from test coverage based on the full fault list. Consider targeting a test coverage for all potential bridge faults: This could be a huge list. You might achieve 99% detection of all bridge faults but miss hundreds of the most likely bridges. It is more effective to choose the subset of bridges that is most likely to occur.
The state-of-the-art strategy for all listed faults/defects is to measure the test coverage as a percentage by dividing the detected number of faults or defects by the total number of faults or defects. Such a calculated test coverage has no relation to the probability of occurrences of manufacturing defects for individual faults. This approach makes it hard to create an optimally ordered pattern set. This leads to overly-large test pattern sets, longer than necessary test time, and lower confidence in estimates of IC quality. These are realistic and common issues we face today.
Now there is a way to measure pattern value that provides a consistent assessment of the value of patterns based on the likelihood of particular physical defects occurring. It is accomplished through the use of critical area (CA). The new CA-weighted ATPG capability gives DFT engineers an easy way to determine the best mix of patterns targeting specific faults and which samples of patterns to experiment with. This is the first time that a total CA calculation for all defects in the digital logic part of a chip has been available in a commercial ATPG tool.
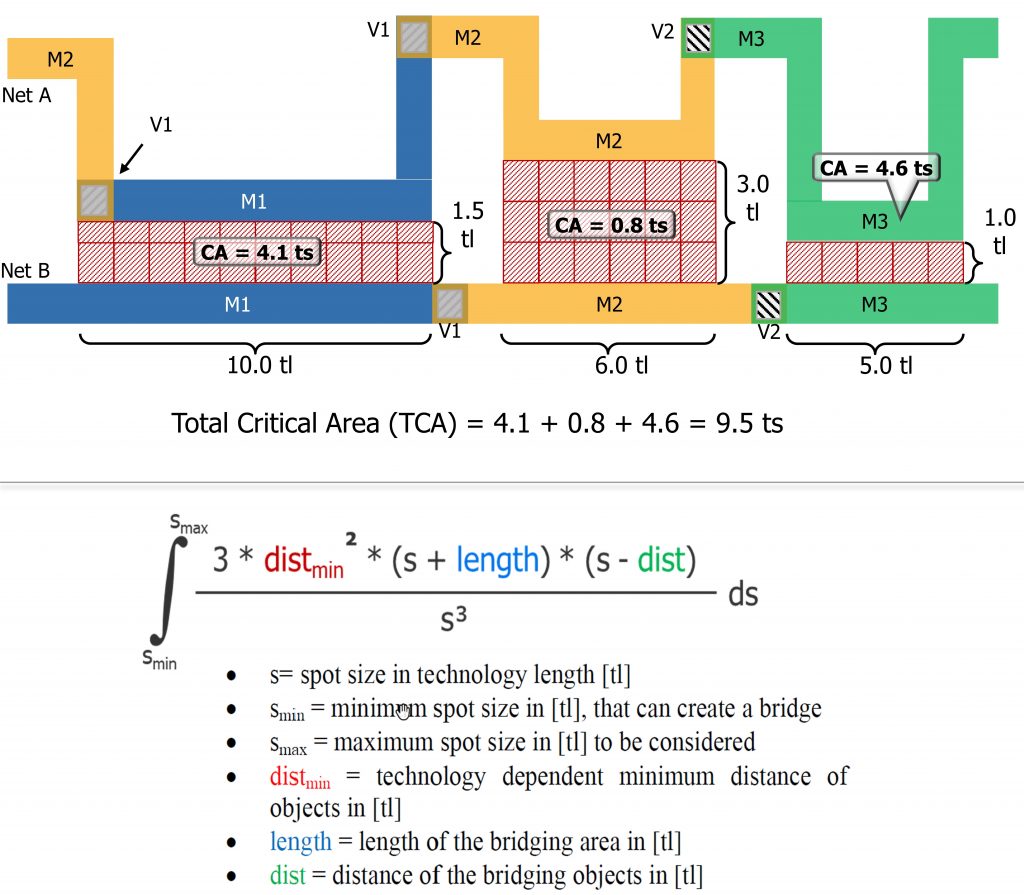
CA refers to the area in a design layout that determines the likelihood that a specific physical defect can cause a failure in the design (Figure 1). Total CA (TCA) is the sum of all individual critical areas of a short between two connectors, or an open in a connection, weighted by the probability of occurrence of that spot size.
When you have a common metric to assess a pattern’s value based on the likelihood of the defect it detects occurring, you can mix in new patterns that target new fault models for a more effective pattern set, even with the same number of patterns as your original pattern set. You can select or sort the most effective patterns from your entire pattern set based on their ability to detect physical defects. Using TCA is a significantly better measure for the quality of the applied test patterns than counting just the number of faults or defects.
Choose your patterns leveraging total critical area
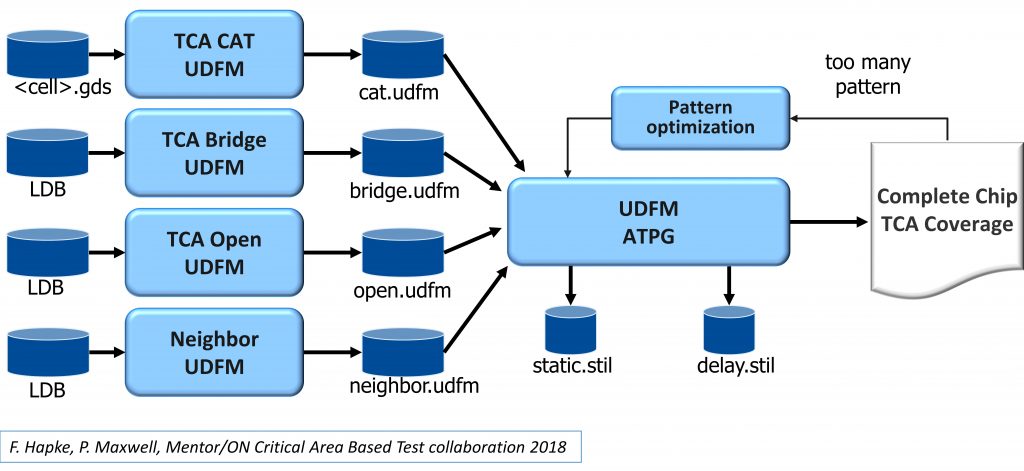
TCA values are calculated using physical layout information. A user defined fault model (UDFM) file stores the models for each defect type (cell-internal, bridge, open, cell-neighborhood). The UDFM files are input to the ATPG tool to generate test patterns and can be used to perform layout aware and cell-aware failure diagnosis.
When read into the ATPG tool, the UDFM files containing TCA fault data can be applied to patterns to sort them from highest TCA to lowest. Figure 2 shows how to load various fault models to optimize your pattern set. It can be used to simulate and calculate the TCA for an existing pattern set or to create a new pattern set from scratch. Reports can be generated to show the TCA included during ATPG, summary coverage, fault list, and a layer-based TCA summary.

Figure 2. Separate UDFM files can be read in to order and optimize the combined patterns based on total critical area (Mentor – click to enlarge)
Some key elements of TCA-weighted ATPG include:
- Selecting the most effective patterns
- Choosing targets for pattern types and coverage
- Determining the effectiveness of new pattern types
- Grading pattern value by likelihood to detect defects
- Automatically sorting and selecting patterns
- Creating a smaller pattern set by targeting multiple fault models in our ATPG run
TCA test pattern sets demonstrated equal or better defect detection with fewer patterns, which reduces test time and cost. TCA-weighted pattern selection represents a major step forward in ATPG for high-quality test in the shortest test time.
You can find out more about the use of CA-based analysis for test in the whitepaper Critical area based pattern optimization for high-quality test.
About the author
Ron Press is the technology enablement director at Mentor, A Siemens Business. He is a member of the International Test Conference (ITC) Steering Committee, a Golden Core member of the IEEE Computer Society, and a Senior Member of the IEEE.
