Extending critical area analysis to address design for reliability
The time-dependent dielectric breakdown (TDDB) of inter-metal dielectrics on large-scale chips is becoming an increasingly important reliability issue across several semiconductor markets. This mechanism can cause early failures in use and is difficult to detect by traditional test, and hard to control by traditional reliability techniques.
Failure data suggests that some of these failures are caused by random particles that do not actually connect adjacent wires (leading to a hard short), but reduce the effective space between them (potentially causing a soft short). This reduction will lead to an eventual rather than an immediate failure because all dielectrics are already prone to degradation over time and the presence of a soft short particle will further reduce the insulating material’s effective width.
Renesas Electronics describes how it is seeking to mitigate TDDB failures by using critical area analysis, an established design-for-manufacturing technique primarily used to date for the identification of immediate causes of chip failure. Since it analyzes much the same data as that which can point to TDDB, the paper describes how its use has been successfully extended to also detect this source of failures that emerge over time.
Advances in IC scaling, speed and functionality enable a huge number of new electronics-based features in advanced applications. However, due to continued miniaturization—which in turn requires the introduction of new materials—it is becoming increasingly difficult to ensure the reliability of very large scale ICs. Reliability is a critical issue in many fields, but particularly in the automotive, aerospace, defense and medical industries. Moreover, today’s consumers expect their mobile communication devices to be extremely reliable.
Critical area analysis (CAA) is already one of the better-known design-for-manufacturing (DFM) techniques and this article describes a way of using it to predict time-dependent IC reliability failures. The results can be used to drive design-for-reliability (DFR) actions during the design cycle.
CAA basics
CAA identifies those areas of a layout with close spacing of interconnect wires. Features that have close spacing are more vulnerability to defects that occur when a random particle falls across adjacent wires causing a hard electrical short. A CAA tool analyzes the physical layout of a chip and computes the total area where shorts or opens could occur when the center axis of a random particle occurs in that area. Using the total critical area, the frequency distribution of expected particles sizes, and how often they are expected to occur, the CAA tool computes the probability of having shorts or opens. The particle distribution is based on sophisticated monitoring of fab clean room conditions and test element group (TEG) measurements.
CAA grows in importance as critical dimensions decrease at more advanced process nodes because the closer the wires are spaced, the higher the proportion of critical area to total die size. This means that for a given random particle size, there will be a higher probability of particle defects. Based on results from the CAA tool, a designer can modify a layout to increase its expected yield by, for example, performing wire spreading to reduce the total critical area.
How physical layout affects reliability
CAA is primarily used to predict the yield based on the rate of random particle failures likely to occur during manufacturing. These failures are found during die or packaging tests, so while they add to the cost of manufacturing, they do not contribute to reliability problems. But a related failure mechanism does affect reliability, and this is where a modification to the CAA procedure has proved valuable.
One typical reliability problem for large scale ICs is the time-dependent dielectric breakdown (TDDB) of inter-metal dielectrics (IMD). Most TDDB defects are caused by intrinsic material failures. However, failure data suggests that some are also caused by soft shorts where a random particle is present but does not completely connect adjacent wires; instead, it reduces the effective spacing between the connectors. As Figure 1 shows, a hard short occurs when a particle extends entirely across the interconnect spacing, while in the case of a soft short the particle reduces the spacing to the effective distance labeled d.
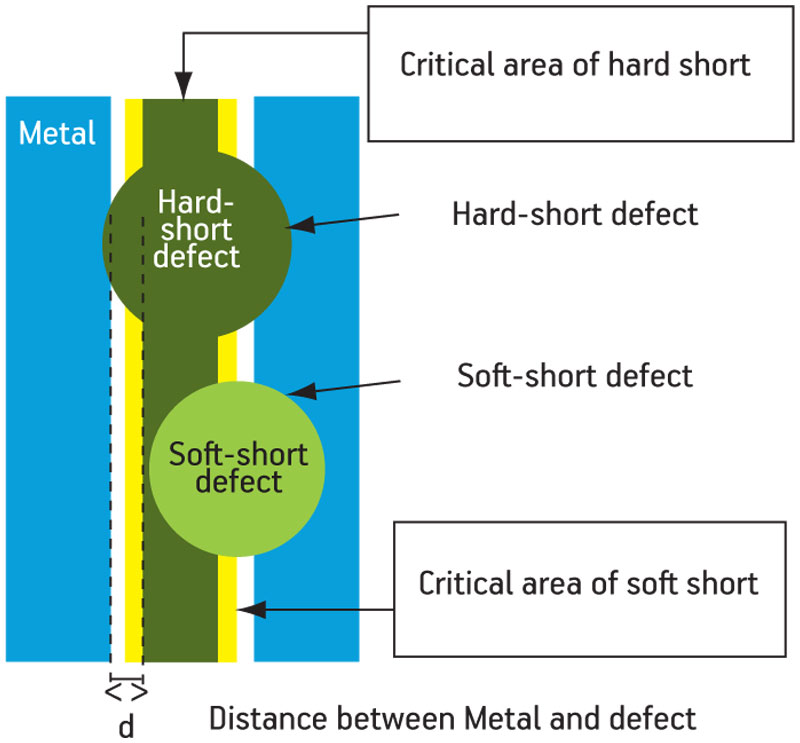
Figure 1
Schematic of defect types. Hard-short defects cause initial (A-mode) failures. Reliability problems (B-mode failures) are caused by soft-short defects
To understand the reliability impact of a soft short, consider that the wires in the IC are insulated by a dielectric that prevents unwanted current conduction between them when the normal voltage is applied. However, all dielectrics degrade over time. The expected time to a breakdown of the dielectric that will result in a short depends on the width of the dielectric. Because the soft short essentially reduces the effective dielectric width, it causes the chip to breakdown earlier, reducing the life and the reliability of the device.
Because of the similarity of the failure mechanism to that for any hard shorts predicted by CAA, we can use the technique to predict the occurrence of soft shorts, giving us an excellent tool for predicting and controlling TDDB failures. The following sections explain this use for a CAA tool.
Extensions to CAA to predict TDDB failures
The soft-fail critical area is calculated with two threshold distances. The first is set to compute the total critical area for the IC related to hard shorts. The second, smaller by the amount d in Figure 1, is used to compute the total critical area for the IC related to soft shorts. The result of the first analysis gives the probability of A-mode failures (i.e., the traditional CAA metric). The second analysis gives a higher probability of failure (POF) based on both hard and soft shorts (i.e., combined A-mode and B-mode failures). Subtracting the first POF from the second produces the POF for soft shorts, giving a metric for reliability related to the TDDB failure mechanism.
Figure 1
Schematic of defect types. Hard-short defects cause initial (A-mode) failures. Reliability problems (B-mode failures) are caused by soft-short defects
We used the Calibre YieldAnalyzer tool to calculate critical area because it has many functions to support CAA, fast turnaround time, and is part of the Calibre Physical Verification Platform.
Validating the model
At Renesas Electronics, we have conducted accelerated life cycle experiments to determine the sensitivity of TDDB failures to minimum defect-metal spacing using a large-scale comb structure. In addition, we used a single-via structure to simulate soft short features. (Figure 2, p. 21). A series of increasing voltages were applied to the large-scale comb structure to generate the failure distribution shown in Figure 3 (p. 21).
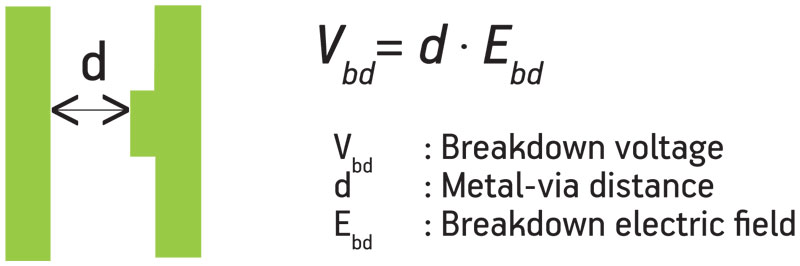
Figure 2
A single-via test structure with features simulating soft shorts with various spacing (d) was used to generate empirical data related to TDDB failures
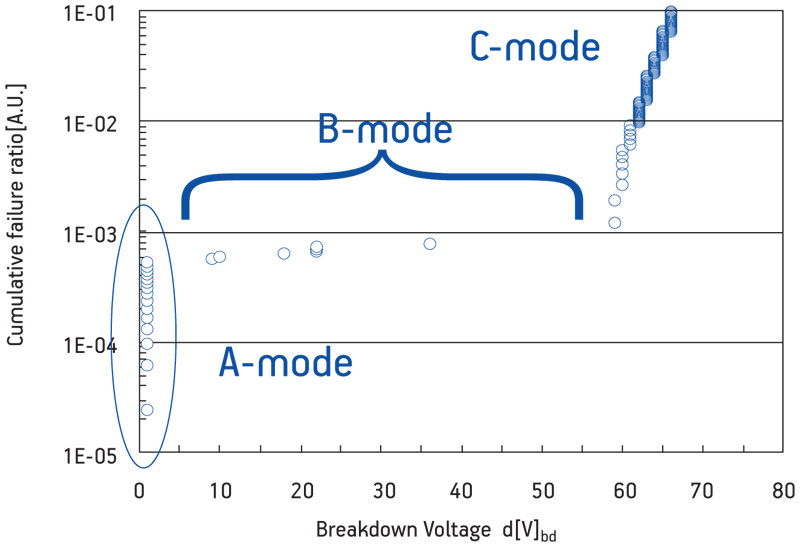
Figure 3
Ramp voltage test results for a large scale comb structure. Mid-range breakdowns (B-mode) between initial breakdowns (A-mode) and intrinsic breakdowns (C-mode) indicate soft shorts
The horizontal axis in Figure 3 measures the breakdown voltage and the vertical axis indicates the cumulative failure rate. Initial (A-mode) failures are caused by hard shorts, (i.e., no electrical field is required to induce the failure by breaking down the dielectric). Intrinsic (C-mode) failures occur when the electric field exceeds the capability of the dielectric material. Of particular interest for predicting reliability are the samples between A-mode and C-mode failures, referred to as ‘B-mode early failures’. These are indications of soft shorts that fail at lower voltages because the effective dielectric width has been decreased, as described above.
Figure 3
Ramp voltage test results for a large scale comb structure. Mid-range breakdowns (B-mode) between initial breakdowns (A-mode) and intrinsic breakdowns (C-mode) indicate soft shorts
Our hypothesis was verified by performing failure analysis on the test structures. Figure 4 shows one of the B-mode failures, indicating that extrinsic defects are responsible for TDDB failures.
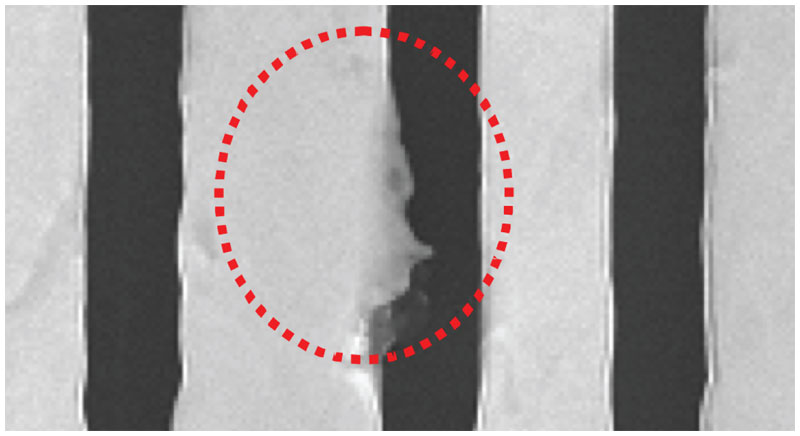
Figure 4
SEM image of one of the B-mode failure samples
Failures as a function of distance d can be converted to failures as a function of time using a test structure measurement as shown in Figure 2 combined with a dielectric thinning model. A comparison of empirical results—using the breakdown voltage test data converted to time-dependent failures with a known oxide-thinning model—to the results predicted using the modified CAA model, showed good correlation (Figure 5).
Figure 2
A single-via test structure with features simulating soft shorts with various spacing (d) was used to generate empirical data related to TDDB failures
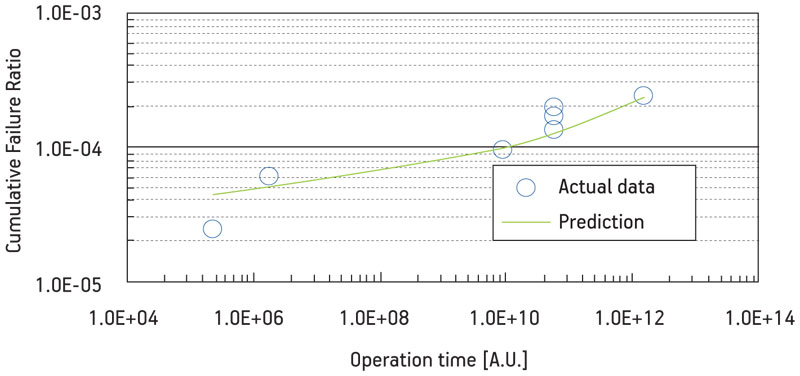
Figure 5
Comparison of empirical results
Application of the CAA Predictor
Figure 6 demonstrates the application of this technique to a DSP module designed according to 130nm design rules. The upper graph shows the B-mode failure ratio at an arbitrary voltage at full scaling, and for 70% and 50% shrinks. Due to miniaturization, the B-mode failure rate is increasing faster than the A-mode rate.
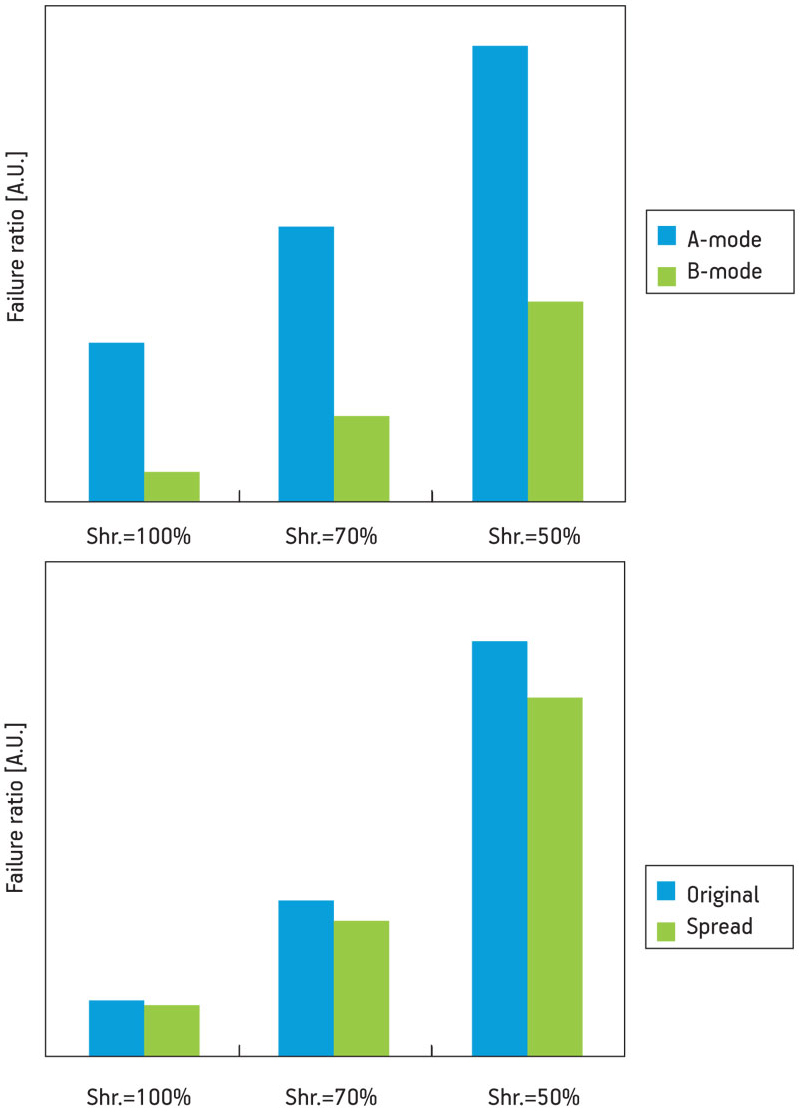
Figure 6
Increasing B-mode failure ratios due to shrinkage (6a) and failure reduction achieved by wire spreading layout improvements
The bottom graph shows the reliability improvement obtained by wire spreading to increase inter-metal spacing. Both yield (A-mode) and reliability (B-mode) are improved. In fact, the degree of improvement actually increases with miniaturization. This is expected because the probability of failures due to random particles increased exponentially with decreasing particle size. Therefore, the impact on soft shorts (which depends on a smaller critical distance threshold) is greater than that on hard shorts.
Conclusion
Critical Area Analysis is commonly used to predict the rate of manufacturing functional failures caused by random particles that can cause shorts or opens in the manufactured device. The traditional CAA calculations can be extended to predict degradation failures resulting from time-dependent dielectric breakdown (TDDB) of copper inter-metal dielectrics. In this way, CAA is able to contribute to Design for Reliability metrics and practices that enhance the reliability of ICs in sensitive application segments.
These results point out an aspect of the DFM discipline that is emerging from industry practice. Actions taken to improve the robustness of the physical design for manufacturing can be used for three different objectives:
- Design for field—increasing the percentage of functioning devices (higher functional yield);
- Design for variability—increasing the percentage of devices that meet performance specification (higher parametric yield); and
- Design for reliability—increasing the life of devices in the field (higher reliability).
While initiating a DFM discipline is essential for achieving acceptable functional yield at advanced process nodes, as their practice matures DFM users will be able to address additional challenges that can help add to their bottom line.
Acknowledgements
This article is based on a paper presented at IRPS 2010 entitled “Modeling of Cu IMD-TDDB Caused by Extrinsic Defects”. This work would not have been possible without the cooperation of the following engineers to whom the author wishes to express his deep gratitude: K. Makabe, M. Ogasawara, E. Murakami, and N. Yoshioka.
Tomohiko Ouchi is a senior engineer in the Yield Management Department, part of the Device and Analysis Technology Division within Renesas Electronics’ Production and Technology Unit. He received his B.S. and M.S. degrees in physics from Ibaraki University, Ibaraki, Japan.
Renesas Electronics
715, Horiguchi
Hitachinaka-shi
Ibaraki-ken, 312-8504
Japan
T: +81-29-270-2986
W: www.renesas.com