Speeding AMS verification by easing simulation debug and analysis
Analog and mixed-signal simulation is becoming more complex as SoCs built using advanced processes demand much deeper characterisation across a growing range of voltages, working conditions and operating modes. The increasing integration of analog and digital components in advanced SoCs demands more sophisticated approaches to the analysis of simulation results – as well as stronger design management to coordinate multiple design teams. And the increasing use of third-party IP may require designers to work with the limited amount of design detail, such as a SPICE netlist only, that some vendors reveal about their IP. All these pressures are being exerted in the familiar context of steadily increasing design sizes, which lengthen the design and verification cycle.
What can we do about this? One obvious answer is to make our simulators faster, something we’re committed to doing with each major release of our HSPICE, FineSim, and CustomSim offerings. The other thing we can do is to make it easier to manage an AMS verification process that uses these simulators and, crucially, to understand and act upon the vast amount of data that these big simulation runs deliver.
Let’s take the management of large simulation runs, which today are usually controlled by home-grown, netlist-based scripts. These often offer limited testbench and regression management, lack much in the way of tools for managing multisite/multiuser projects, don’t have many data analysis or data-mining facilities – and may be difficult to maintain and support. There are similar drawbacks to integrating a third-party simulation environment. They may have limited access the host simulator’s most advanced features, use proprietary languages and database formats, and limit users to their own debug and waveform-viewing facilities.
There are also issues in using third-party IP with this approach. If a team uses internally developed IP, it should have good access to the detailed design database, but if the IP comes from a third party the team may only have a netlist. This then has to be integrated with the rest of the design using scripts to knit the two together, in a process that is likely to be both time-consuming and error-prone.
We’re addressing these issues in the next (2016.3) release of our simulators by giving them a native Simulation Analysis Environment (SAE), designed to ease the integration, management and analysis of large AMS simulation runs. We hope that with the facilities this brings, we will be able to change the way verification engineers do their jobs.
SAE will provide a common environment for all our circuit simulators, and for each step of the verification process – testbench setup, simulation management, analysis and debug. The environment will directly ingest Spice, SPF, DSPF and Verilog netlists – and then ease the process of setting up testbench types, analysis strategies and output measurements.
One of the advantages of this approach is that it will help design managers apply some coherency to the verification strategies of their teams. In the previous approach, one designer may have authored their own scripts to run corner cases, sweeps, and Monte Carlo analyses. With SAE, these setups can be configured through its user interface, and then reused by others – enabling managers to bring some coherency to the verification strategies applied throughout a widely distributed design team.
SAE offers a similar advantage in terms of testbench consistency, since the same testbench can be applied to the design throughout its elaboration from a detailed netlist that may need an HSPICE analysis through to a mixed-signal verification effort using Synopsys’ VCS AMS. The environment is structured so that individual blocks can be swapped in and out as they are updated, too.
SAE will also manage the process of applying detailed parasitics information, developed during the layout process, to the right elements of the pre-layout netlist, rather than having to add the parasitics through a scripted process. This removes a source of potential error and makes it easier to do a pre- and post-layout comparison building on all the work, such as defining outputs, that was done in the pre-layout phase.
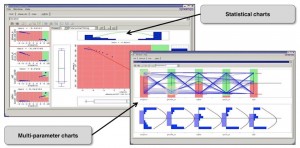
The last piece of the puzzle is to make the analysis of simulation results much easier to navigate and understand. Output data can be displayed in tabular form, as it becomes available, with dynamic filtering (on criteria such as pass/fail) and traffic-light coloring for easy visual comprehension. SAE also offers a variety of approaches to statistical charting, including scatter plots, mean values, and multi-parameter charts.
Figure 1 Multi-parameter visualizations aid design centering (Source: Synopsys)
At the bottom righthand corner of Figure 1 (see above), multiple parameters are being superimposed as blue lines over five ‘bins’ (the green and red bars). Users can trace along each parameter to see in which context it is causing an issue, and then use these insights to help them undertaking design tuning and centering.
To ease documentation, SAE will also generate HTML reports that include everything in the simulation environment, including the data and waveform images.
All the configuration, setup and visualization facilities described above are in the environment, centralizing the work of setting up, running and analyzing complex AMS verification strategies in distributed, multi-user, multi-site projects.
Further information
SAE will be part of the 2016.3 release of these tools.
Synopsys is offering a live webinar entitled Improving Analog Verification Productivity Using Synopsys Simulation and Analysis Environment (SAE) on Wednesday, February 17, 2016 at 10:00AM PST.
Author
Geoffrey Ying is director of product marketing, AMS group, Synopsys
