Modelling envelope-tracking RF PAs for LTE at high dynamic range
Current techniques for modelling RF power amplifiers don’t provide the dynamic range necessary to simulate their performance properly when used in the energy-saving envelope-tracking mode necessary to give LTE terminals a decent battery life.
Building 150dB RF PA models
As envelope-tracking power amplifiers (PAs) become a feature of 4G handsets, developers of ET-enabled chipsets need a system simulation environment with around 150dB of dynamic range to make design tradeoffs and optimise system performance. One of the barriers to achieving this is the simulation model of the RF PA, because today’s measurement techniques only provide around 90dB of resolution. This article illustrates how a high dynamic-range PA model can reduce this noise floor to around -150dB, enabling the system designer to evaluate the impact of each source of noise and distortion.
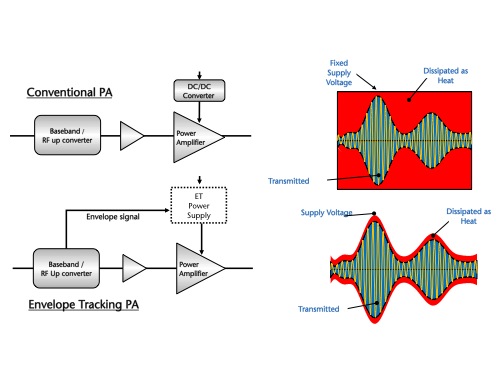
Envelope tracking (ET) is a technique for improving the energy efficiency of RF power amplifiers (PAs). The traditional DC:DC converter supplying the PA is replaced by a highly agile ET power supply that modulates the power supply pin of the RF PA with a high-bandwidth, low-noise waveform, synchronised to the instantaneous amplitude (or envelope) of the signal being transmitted. This means that the PA is always operating in a highly efficient compressed state, in which its supply voltage is just sufficient to enable the PA to transmit the instantaneous output power required, as illustrated in Figure 1.
Figure 1
Envelope tracking PA operation (Source: Nujira – click image to enlarge)
System design tradeoffs
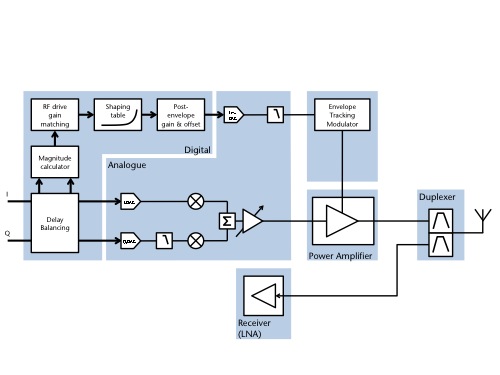
To implement an ET system, chipset designers must add an envelope-generation path to their modem/transceiver chipset, to produce the envelope signal needed to feed the power-supply modulator. Figure 2 illustrates the system environment in more detail.
Figure 2
Envelope tracking system model (Source: Nujira – click image to enlarge)
The functions of this block can be implemented either in digital logic or DSP, and may be integrated into either RF or baseband ICs. A high-speed data-processing pipeline takes I/Q data samples from the modem, and routes them through a programmable delay line that keeps the signals on the RF and envelope paths aligned in time. The pipeline then calculates the instantaneous amplitude (envelope) of the RF signal as √(I² + Q²), passes it through a programmable nonlinear look-up table, and sends the resultant signal to a high-speed D/A converter.
In any frequency-division duplex (FDD) system, such as the 4G LTE standard, the isolation between the transmit and receive paths in the handset represents a key performance parameter. As both paths operate at once, it is critical to ensure that out-of-band noise generated by the handset’s transmitter does not degrade the sensitivity of the receiver. Although the TX and RX circuits are separated in frequency and isolated by a duplex filter, there is still some coupling (with typically 50-60 dB attenuation) between the TX and RX paths. This results in some of the transmitted signal leaking through into the receive band, where it appears as additional noise and so reduces the sensitivity of the receiver.
In an ET system, there are additional sources of noise and distortion, the impact of which system designers must model through a combination of spreadsheet-based power level planning and simulation, before making the appropriate tradeoffs in their system. For example, the required DAC resolution depends on the sampling rate, and both parameters are influenced by the delay error between the RF and envelope paths. As another example, the minimum bit width for the digital-processing pipeline is dependent on the target performance of the duplex filter. With so many interactions and co-dependencies to consider, comprehensive system simulation is the only viable way to make the necessary system tradeoffs.
While most of the digital and analogue processing functions used in the system model are well supported in simulation environments such as Agilent’s Advanced Design System (ADS), a suitable model for an RF PA operating in ET mode is missing.
Under ET conditions, the PA operates in compression for a large part of the modulation cycle. In this state, the output of the PA is strongly influenced by its power supply – in fact the PA is operating as a mixer, with two inputs and one output. This requires a simulation model which relates the PA output to both the RF input signal and the waveform applied to the supply pin.
S-parameter and X-parameter models
Traditionally, it has not been possible to use simple modeling techniques such as S-parameters to describe the behavior of RF PAs. More recent evolutions, such as X-parameters, offer better non-linear modeling for such devices. These multi-port nonlinear measurement and modeling techniques are a big step forward in representing the influence of the PA power supply pin on its output.
However, the models offered by PA vendors are usually captured by lab test equipment, using a network analyser to sweep input parameters and capture the data in a series of tables. The X-parameter simulation model interpolates between these data points to provide an approximated simulation response.
For an ET PA, the conditions under which the data was captured are very important. The PA characteristics can depend strongly on temperature, so measurement data captured under continuous wave (CW) conditions can be very different to those captured under pulsed RF or true ET conditions, due to thermal effects.
The major limitation of these captured X-parameter models for ET simulation is that they are too ‘noisy’ for use in system modeling. Measurement noise, quantization and data interpolation typically result in a noise floor (dynamic range) of -90dB in the simulation model, drowning out the other contributors to system noise and distortion. The system designer therefore needs a PA model with much higher dynamic range – typically 150dB – than is possible with today’s measurement technology.
Nujira’s HDR PA model
To overcome this problem, Nujira has developed a high dynamic range (HDR) PA simulation model. Instead of interpolating between measured data points, the HDR model uses an algorithmic representation of the PA behavior to generate a continuously variable output, eliminating measurement noise and quantization errors. This mathematical modeling approach enables a simulation environment with almost 150 dB of dynamic range.
The gain, phase and efficiency responses of the HDR PA model can be parameterized using coefficients extracted from real device measurements. The model can also be run with phase distortion (AM/PM) disabled, enabling the system designer to model a ‘perfect’ memoryless PA. This gives the designer full visibility of the contributions from, and interactions between, the other system elements.
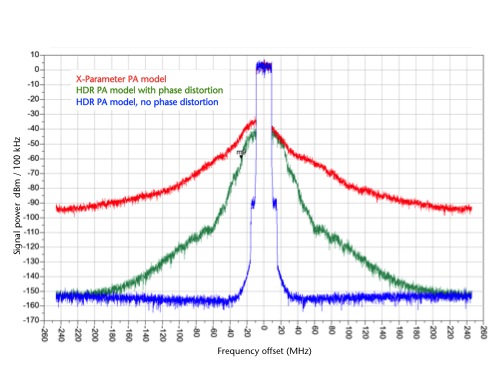
Figure 3
Simulated output spectrum from X-parameter and HDR PA models (Source: Nujira – click image to enlarge)
Figure 3 compares the simulated ET PA output spectrum plots from a captured X-parameter PA model (red), and the HDR PA model, with (green) and without (blue) AM/PM distortion enabled. It clearly shows the extended dynamic range of the HDR model.
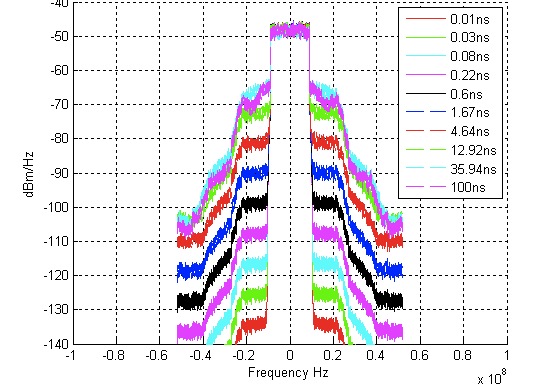
Figure 4 gives an example output from the overall system simulation model, in this case modeling the contribution of timing alignment errors between the RF and envelope signals to system distortion for a 20MHz LTE signal. The extended dynamic range of the simulation environment enables the system designer to see the impact of timing alignment errors on system performance that would have been lost using the X-parameter model.
Figure 4
Influence of timing alignment error on output spectrum (Source: Nujira – click image to enlarge)
The core HDR PA model includes sources of distortion generated by the PA (AM/AM and AM/PM), but not of PA self-noise – this can be easily modeled at the system level by adding one of the standard ADS noise sources. This gives the system designer maximum flexibility in modeling system performance with a ‘real world’ ETPA or a ‘perfect’ one.
Instantaneous PA current consumption is modeled using a traditional data-table driven approach, since the same dynamic range is typically not needed for measurements of supply efficiency.
Conclusions
For a system designer developing ET transceivers, an HDR system-simulation environment is essential to identify and optimise the multiple sources of noise and distortion.
Although S-parameters and X-parameters provide useful models for certain aspects of RF PA characterization, the quantization noise inherent in captured models results in a noise floor that masks other effects.
The HDR PA model uses a mathematical representation of the PA performance operating under envelope tracking, greatly improving the dynamic range of the simulation environment, and giving the system designer full visibility of the noise and distortion contributions from each of the system blocks.
Nujira’s HDR PA model is available to members of the OpenET Alliance as an ADS Design Kit component, and also forms part of the OpenET Alliance’s ET System Simulation Model, jointly developed by Nujira and the University of Firenze.
Read more about the rationale for envelope tracking here.
Company
Nujira Ltd Building 1010 Cambourne Business Park Cambourne Cambridge CB23 6DP UK T: +44 1223 597900 W: www.nujira.com


