The evolution of software debug using hardware emulators
We look at how best to leverage both software debug tools and emulators, the limitations to traditional techniques, and the drive toward offline debug.
More than 90% of all system-on-chip (SoC) designs contain embedded processors that must be tested in the context of the final design before silicon is available. You cannot fully validate the functionally of an SoC without including some embedded software and this is where things get complicated.
The Association of Computing Machinery (ACM) says there is typically one error for every eight to 12 lines of new software source code. After debug, error rates drop to one to five bugs per 100 lines of source. Given that any meaningful body of software used in verification has thousands of lines of source, the embedded software bug count will be around 100.
The problem is clear, but the solution is not. Software debug using hardware emulation is today mandatory because of the immense processing power inherent in the combined tools. Unfortunately, it is not inexpensive. It is not just about the cost of emulators. Software development teams outnumber hardware design teams by a significant margin. Therefore, you could conclude that the tool investment will skyrocket.
Is there a way break this conundrum? The answer lies in moving software debug offline after an online emulation session. In fact, the method follows the same pattern used for hardware debug: Capture waveforms in emulation and debug later.
We are now seeing the first wave of tools that allow for this kind of offline software debug. To understand why it is needed, let’s explore software debug in general in the context of the three historically dominant strategies.
Traditional software debug with emulation
The most common software debug technique uses a JTAG probe. It is connected either physically or virtually to the design under test (DUT).
An alternative is to use trace-based methods. Here, information is collected from the DUT and then presented to the developers in a tabular format to help them understand the operations of the software.
Physical JTAG
This most basic level of debug attaches a physical JTAG probe to the DUT mapped inside the emulator. JTAG signals from the DUT are traced to an I/O card installed on the emulator, and a physical JTAG probe is connected to these I/Os. The probe interfaces to a debugger that controls and examines the software running on the processor or processors.
The main benefit of this approach is that it is well understood because it works in a nearly identical manner to running the probe on a development card. An additional benefit is that the JTAG protocol used by the probe is generally unaffected by the slower clock rates of an emulator.
When connecting physical devices to a virtual design running in an emulator, the clock and data rates need to be reduced to match the speed of the design in the emulator – generally 10 to 100 times slower than real time.
For many devices, it can be a challenging task. Fortunately, for JTAG, it is a simple matter of reducing the clock rate to match that of the emulator.
As for a physical development board, Code may be downloaded to the design. Also, breakpoints can be set. Then, variables, registers, and memory can be examined and changed. The developer can run continuously or step-by-step through the code being debugged.
An example is Mentor Graphics’ Veloce2 emulation system. It provides a conventional physical JTAG connection to enable this approach. However, there are issues related to physical JTAG connections.
First, while the JTAG protocol tolerates almost any clock speed, many probes do not tolerate clock starting and stopping. If the emulator is started and stopped, there is a risk that the connection to the probe will break. The emulator may stop to allow the hardware developer to upload signal traces, to debug the hardware, or it to allow an Open Verification Methodology (OVM) or Universal Verification Methodology (UVM) testbench to compute new stimuli. As testbenches become more complex, this will happen more frequently.
Second, the JTAG connection is intrusive and will impact the state of the design. For some classes of bugs, this is irrelevant. For others, it is a significant problem.
The JTAG probe does its work by putting the processor into a debug mode, and serially shifting-in commands and serially shifting-out results. The time needed for this depends on the length of the JTAG scan chain, which varies by processor and by design. Even simple operations take hundreds of thousands of clock cycles, while complex operations can take millions.
The implication is that it is difficult to correlate activity of the hardware design with what is taking place in software inside the processor. The emulator can be stopped to enable a view into what is going on in the hardware. Once the hardware stops, so does the JTAG clock used by the probe. So, when the hardware is visible for debug, the software debugger is frozen. When the software debugger is running, the state of the hardware cannot be viewed.
And the intrusive nature of JTAG along with its impact on multicore synchronization can make the debugging multicore execution unwieldy.
Virtual JTAG
An alternative is to attach the probe over a virtual JTAG connection. This mitigates the first limitation with physical JTAG, but not the second.
Departing from the traditional deployment called in-circuit-emulation (ICE), all modern emulation systems can interface a program running on a general-purpose computer to the emulator through a high-speed communication channel and drive or sample signals to/from a DUT mapped in the emulator.
A module that drives and samples a set of signals on a communication channel is often referred to as a ‘transactor’ and is controlled by a program on a remote host computer. An example is a JTAG transactor that allows a software debugger to control one or more processors in the DUT inside the emulator.
This connection provides the same functionality as a physical probe using a physical connection. The difference is that the ‘wires’ that connect to the design are virtual and not physical. Also, the conversion of the debugger operations into JTAG transactions is not performed by a separate physical probe, but by a process running on the emulation host.
Running a virtual probe over a physical probe offers several benefits. The first is that the connection to the probe will not be disturbed by starting and stopping the emulator. The emulator can be started and stopped at any time, and the clock frequency can be varied without concern for interrupting the connection to the software debugger.
A second, more subtle benefit is the flexibility in loading the DUT into the emulator. Modern emulators are multi-user resources that allow multiple designs to be loaded and run concurrently. If there are I/O cards attached to a design, the design must be loaded and run in specific locations to allow connection to the outside world. Eliminating the physical I/O enables the design to be loaded wherever there are available emulation resources.
However, virtual probes have the same limitation noted above with respect to the intrusiveness of the debug operations. This is a result of the way that JTAG operates and will be a limitation of any JTAG-based solution.
The Mentor Graphics’ Veloce2 emulation systems, for example, support virtual JTAG connections such as VSTREAM from ARM and its own developments.
Processor Trace
An alternative to JTAG is to use trace-based systems to enable debug of programs running on the emulator.
A basic processor trace is a tabular listing of events that took place in the processor. Generally, these traces will include instructions executed, memory operations (such as reads and writes with addresses and data values) and register updates.
Looking at the table, a software developer can infer the activity of the processor and correlate it back to the original source. Some debug environments, like DS5 from ARM, provide a trace viewing tool with an automatic link back to the original software source. The processor trace has the benefit of not interfering with the execution of the program. It is non-intrusive and it does not impact the execution of the system being debugged.
Here is an example processor trace from an emulation of an ARM system:
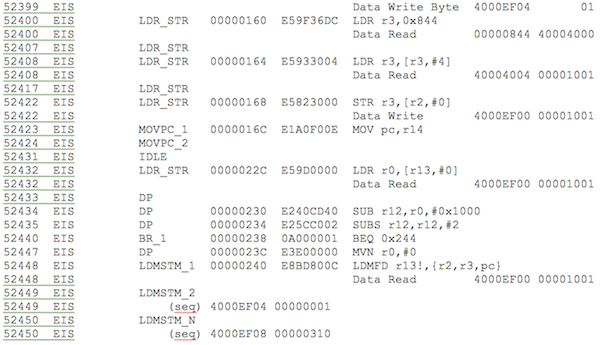
FIGURE 1. Processor trace from emulation of an ARM system.
Processor trace is one of the most rudimentary software debug tools and leaves plenty to be desired. For example, it does not have symbolic information or interpretation. If users want to know the value of a variable, they need to manually decipher the symbol table of the program under test and correlate it with the trace information.
Moving software debug offline
Moving debug offline takes us another step forward in addressing some of the limitations outlined above with flavors of JTAG and simple processor traces.
Consider this scenario that uses Mentor Graphics’ Codelink. This is a software debug environment used with emulation or simulation. Based on trace, it includes a traditional debugger view of the state of the processor and does all the symbol table and processor state decoding. Since it is based on tracing technology, it does not intrude on or interfere with the operation of the system being run.
Codelink traces the state of the processor by observing signals in and around the RTL code of the processors in the design. It records the state changes to the processors in a similar manner to a tabular trace file. These changes include instructions executed, memory transactions and register updates. These state changes are stored in a binary compressed database.
The important part of Codelink that takes us offline is its Replay Server. This reads the database and reconstructs the state of the processor and its memory subsystem at any point in time during the emulation or simulation. This function can connect to traditional software debug environments like Eclipse, which act as clients to the replay server.
Since a traditional debugger view can be fully populated with just memory and register contents, the replay server can act as a virtual target and respond to a debugger’s requests. The debugger will ask for memory or register values and interpret these values to produce the display familiar to software developers.
Additionally, the replay server can respond to requests from the client debugger to either ‘step’ or ‘run’. In this scenario, the server will advance through the database and then respond to memory and register requests for the new forward time. Using the results of these requests, the debugger is able to populate the software debugger views that developers expect, such as source, register, memory and variable windows, and a stack or frame window.
Since the state of the target is reconstructed from a trace database, the state can not only be advanced forward through time, but backward as well. This enables debug clients that support backward debug operation, which includes the latest Eclipse-based debuggers, to run and step backwards through the code.
From the perspective of the debugger, the replay server looks just like a development board or a physical prototype. It makes the same requests and receives the same results from the replay server as it would from any physical target. For most operations, the software developer will find it indistinguishable from a live target.
It has the ability to interactively use a ‘printf’ statement without involving compilation. Software developers commonly use ‘printf’as a debug tool to watch the value of registers, variables and memory. With JTAG and other debug methods, issuing a ‘printf’ requires the recompilation and rerun of the DUT. Codelink can add a ‘printf’ statement during offline debug. Users can back up and add a ‘printf’ to see immediate results in CodeLink windows.
Traditionally, software developers expect some slowdown when trying to debug on an emulation system since the target, or emulated system, is running at 10 to 100 times slower than real time. Codelink can be run off the replay database after the emulation has completed, and can run at speeds of 100 MIPS. It does not require a long sequence of serially shifted commands to control the processor like probe-based debug environments.
As well, Codelink is able to correlate the software view across multiple cores with the state of hardware waveform views, enabling concurrent hardware/software debug visibility, impossible with a probe-based debugger connection.
One limitation of Codelink, however, is that the state of the target being debugged cannot be altered. Since the debugger view is reconstructed from a trace of the processors in the design, memory, registers or variables cannot be set to a new value and then execution continued with new state. Codelink is a read-only debug environment.
Conclusion
Embedded software has become an integral part of the functionality of most SoC designs and a powerful vehicle for SoC validation. Any development and verification strategy that does not take this into account will leave developers at a disadvantage in today’s highly competitive world.
Codelink is the first offline software debug tool for emulation. Moving forward, I believe that we will see more such tools and that more embedded software debug will be performed offline after an emulation session. Meanwhile, fewer implementations will use JTAG –– a major shift from the how things have been done for the last decade.
For me, that suggests times are changing for the better, bringing further efficiencies to an increasingly important aspect of electronic system design .
About the author
Lauro Rizzatti is a verification consultant. He was formerly general manager of EVE-USA and its vice president of marketing before Synopsys’ acquisition of EVE. Previously, he held positions in management, product marketing, technical marketing, and engineering. He can be reached at lauro@rizzatti.com.
