A better method for early and accurate power estimation
Early and accurate SoC power estimation is possible, says Broadcom, thanks to a technique that maps simulation results between gate and RTL representations
As battery life and energy consumption have become critical system parameters, power has challenged performance for primacy. Plenty of things are “fast enough,” but they still drain their batteries too quickly. So systems-on-a-chip (SoCs) must be designed to meet stricter power limits than ever before.
Unfortunately, using a traditional flow, you can’t get an accurate power assessment until you have a full gate-level representation of the complete chip, after timing closure has been achieved. This means that you won’t know whether you’ve met your power requirements until very shortly before tape-out – or even after. Whether power analysis happens before or after masks are cut, it is far too late to allow for any design changes.
New flows from tools like Synopsys’ Verdi and Siloti, however, allow for power estimation earlier in the design flow. Accurate to within 2-4% of final gate-level results and much faster to execute than a full-chip analysis, such a flow lets designers tune the power of their blocks while there’s still time to do so.
Full-chip analysis will still be required for sign-off, but the earlier analyses will mean that any power issues will already have been uncovered and remedied, making the sign-off analysis one of confirmation, not of discovery. We at Broadcom did some experiments with the Synopsys flow, and we were encouraged by our results.
Earlier, faster power analysis
Not only is traditional analysis late; it also takes too long: many hours, or even days for a very large chip. This is because power analysis requires a full dump of all of the signals during a gate-level simulation, so the number of nets being analyzed is enormous – and yet only a subset of those nets really matter.
In addition, critical peak power consumption occurs only in certain configurations and modes of the chip. There may be a few microseconds of activity that merit full analysis, but getting the system into that state may require simulating many milliseconds of setup events – you can’t just jump to the timing window that you want to analyze.
Fig 1 It takes many cycles to set up a verification state
If you are going to optimize a block for power, then power information has to be available while the block design is still in progress. This is the best timing for a number of reasons: the design hasn’t been frozen yet, so changes aren’t a disruption; you haven’t diverted your attention to a new project yet, so fixes won’t compete with anything else; and this design is still top-of-mind – you don’t need any time to come back up to speed.
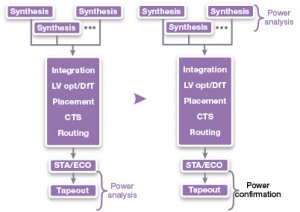
The following figure illustrates the many steps between design and tapeout. Traditionally, all of those steps had to be completed before power analysis was possible. What we wanted to do was to move the main analysis activities up with the design and synthesis steps, reserving the final full-chip analysis as a confirmation that all of the fixes undertaken were successful in meeting the power goals.
Fig 2 The goal - move power analysis earlier in the flow
Even when running analysis earlier in the flow, we need gate-level representations of the block. But the critical advantage is the fact that we don’t need to wait until all blocks and the rest of the steps had been completed. This means that, as a designer using this flow, you can take ownership of your block’s power independently of the other designers on the team.
New tools in the flow
The ability to do this earlier analysis springs from tools that might not, at first blush, be obvious. We wanted to use a comprehensive database for simulation results, along with a way to correlate the gate-level netlist elements with the higher-level RTL elements. In our work, the fast-signal database (FSDB) took on the database role; Synopsys’s Verdi and Siloti tools handled the critical mapping between gates and RTL.
Verdi has historically played a role principally as a debug tool, but its connection to the FSDB and its open, scriptable interface have resulted in it playing a more general role as an analysis tool. This let us use these tools in a way that had only a faint link to debug.
The high-level approach we took was to analyze a specific block in enough detail to infer its power characteristics – with, as we’ll see, surprising accuracy – while feeding the block with signals from other blocks. The trick to being able to do this quickly, however, involves two optimizations:
- We generated only signals that matter for analysis. A full simulation dump creates an enormous number of signals – and yet most of those can be inferred from a few essential signals and knowledge of the design (which we have through the tools). Significant time can be saved by restricting analysis to those essential signals, filling in gaps only when needed.
- We ran a detailed simulation only on the time window of interest. This involves making available the system state at the start of the window to avoid replaying all of the setup events. How we did that is described further on.
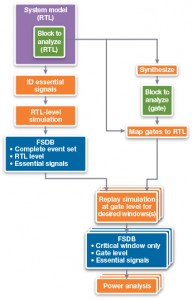
The first step was to analyze the design to find that minimal set of essential signals whose results would be stored in the FSDB; Verdi did that for us. We then ran a complete RTL-level simulation of all of the involved blocks – including the block we were trying to analyze for power. What we ended up with was a complete record of all of all of the essential events at the RTL level. Because we were simulating at this level instead of at the gate level, the simulation time was reasonable.
In order to establish a gate-to-RTL mapping for our block, we first needed to synthesize the block we were going to analyze. We then created a correspondence so that the RTL results for our block in the FSDB file could be translated to gate netlist signal events. And because we captured an entire simulation run in the RTL simulation, we could replay the events starting from any point, jumping immediately to the start of the window over which we wanted to evaluate the power.
Rather than replaying the events for our block at the RTL level, however, we used the mapping to translate them to gate-level events, letting the tool use its knowledge of the design to fill in signals that weren’t originally considered essential. We then had the gate-level simulation results we needed to get a more accurate power analysis result over only the windows of time when power peaks. If we had had multiple windows that we wanted to evaluate, each of those replays could be done in parallel on separate servers, further reducing the time it took to get our power analysis results.
Fig 3 Broadcom's approach to earlier power analysis
Experimental results
We used this approach on two different designs in order to assess the flow and results accuracy. The first example was done on a mature chip design. A gate-level simulation was done to establish a baseline against which the new flow could be compared for both average power and peak power accuracy. The replay strategy delivered average power results that were within 2-3% of the full analysis done at the gate level, and peak power results that were within 1%. We also compared this to the approach of plugging in RTL waveforms directly into an RTL-level power prediction tool, which gave results that were 40% optimistic compared to the full gate level analysis.
Table 1 Comparing replay techniques with RTL power estimation
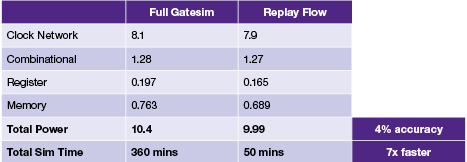
Another example was done by a different group in Broadcom on a full-chip design. It had 1.5 million placeable cells, and the window of interest for power analysis was 100 µs – with a 10-ms setup. Doing a full gate-level simulation took 6 hours; the replay methodology took 50 minutes – 7 times faster. In this case, the replay results were within 4% the full gate simulation results.
Table 2 Comparing gate-level and replay speed and accuracy
Early power verification
Power verification has been transformed from a nice-to-have data check into a full-fledged validation of a critical performance criterion. But typical chip-level power analysis has typically come far too late in the process to be useful. By the time we knew whether or not we’d missed our power target, it was too late to fix it.
By leveraging tools like Verdi, we have found that we can do a surprisingly accurate analysis at the block level while the design is still underway. At that point, we can still address any power misses – in the same manner as we fix timing misses. A well-constructed design schedule should not be impacted even if some power optimization becomes necessary.
Through this flow, we can elevate power to join area and performance as a key deliverable that can be verified during the design cycle. We still do a full chip-level validation analysis as a means of signing off on the overall power before committing to masks, but our earlier optimization work should make this step one of confirming what we already know, not one of suddenly getting a surprise that either delays the project or misses the power goal. With early power verification, we will be able to deliver a better product on time.
Author
Steve Thomas is a senior principal engineer at Broadcom. He has worked at Broadcom for more than 15 years and is part of a team that develops high-speed, physical layer interconnect products. Steve’s focus is on methodology for design teams in the areas of synthesis, timing closure and power reduction.


