Energy debugging – the next step in MCU software optimization
Knowing where your application is consuming resources is a crucial step in minimizing energy usage. The article describes a toolset developed by high-profile ARM-based microcontroller (MCU) start-up Energy Micro that helps to achieve this overarching goal within the context of a parallel move to 32bit MCU resolution.
Almost all applications running on microcontrollers (MCUs) today need to be far more aware of how they consume the precious resources available to them in terms of memory, clock cycles and, perhaps most important, energy. And while engineers may instinctively know how much power or energy an application should consume, it is only through close examination that those instincts are borne out. Typically, that examination takes the form of a simple current measurement averaged over a given time and then extrapolated to deduce the total life expectancy for, say, a single battery cell.
With much greater emphasis now being placed on configurable and programmable solutions, most typically in the form of an MCU, a greater proportion of the energy consumed can be attributed to the processor core and its peripherals. That is the main reason why the semiconductor industry is now seeing a significant increase in ‘ultra-low-power’ MCU solutions.
Traditionally, 8bit or 16bit devices have been used in energy-sensitive applications because their cores are small, have relatively few gates and produce low levels of leakage current. Applications today however demand far more processing capability than such resolutions can offer.
It has been assumed that the current drawn by a 32bit core in power-down mode must be too great for energy-sensitive applications. This is a misconception. By harnessing the full range of low-power design techniques available, 32bit cores can be implemented that offer low-power modes as good as or better than 8bit alternatives.
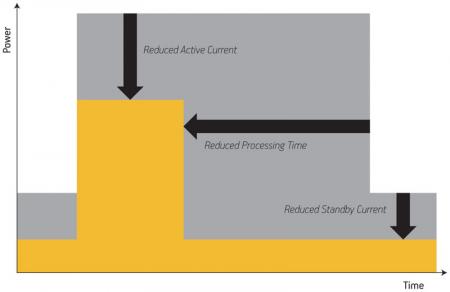
Energy Micro’s EFM32 Gecko MCU is one of a new breed of energy-friendly devices developed to minimize the product of current and time (i.e. the real energy) over all phases of MCU operation. Compared to smaller processor cores, such an ARM Cortex-M3-based device as the Gecko will finish a task quicker, enabling it to spend more time in low-power modes, thereby lowering the average power consumption even further (Figure 1).
Figure 1
The blue area indicates the energy saved by a 32bit core completing a task in fewer cycles than an 8bit core would require and consuming less current in active and sleep modes
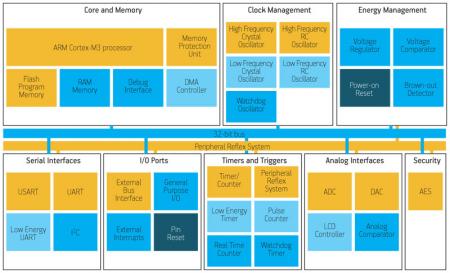
In fact, the Gecko has proved capable of consuming a quarter of the energy required by alternative 8bit, 16bit or 32bit solutions. This performance is achieved in no small measure through the combination of a low-energy peripheral set, a peripheral reflex system (enabling peripherals to function autonomously of the core), five distinct and graded low-energy modes, and very fast wake-up times. The architecture for the Gecko is shown in Figure 2.
Figure 2
Chip architecture for Energy Micro’s Cortex-M3-based EFM32 Gecko microcontroller
However, to achieve the lowest possible energy consumption, one cannot overlook the crucial role played by application source code. Code needs to be engineered to make best use of low-energy peripherals and modes, if battery lifetime is to be maximized.
As source code bases grow in size, it becomes increasingly difficult to identify, for example, what loops should be replaced with an interrupt service routine: a simple code oversight that could cause the processor to remain fully active while waiting for an external event instead of going into sleep mode.
This kind of pseudo-random event can easily be missed when examining the code or testing under ideal conditions and it is difficult to capture during soak testing. Similarly, sections of code that consume a disproportionate amount of energy may be impossible to identify from a pure code listing alone.
While a multimeter reading or oscilloscope trace may produce an average level of energy consumption over a given time, it cannot identify the current consumed by specific events. Likewise, a logic analyzer can display when and how many times a particular routine is executed, but it cannot correlate that with power surges.
Energy Micro has sought to overcome these limitations by developing a solution that provides not only the level of instantaneous energy being used, but also correlates that information with the actual code being executed at the time.
The energyAware Profiler is an ‘energy debugging’ tool for the PC that exploits a dedicated Advanced Energy Monitoring (AEM) system present on existing EFM32 Gecko development kits. While the AEM is capable of displaying the application’s real-time current consumption via an LCD display onboard the kit, the real power of energy debugging is realized when the Profiler software is used.
The software runs under Windows and interfaces with the development kit via USB. Basic data transferred from the development kit allows the PC to display a real-time energy profile of the application code running on the target MCU.
A default configuration displays energy levels over time, allowing an engineer to identify specific areas of concern where the energy used is possibly higher than expected. Extrapolating this over time can also give a more accurate indication of life expectancy for a battery-powered application than estimates based on best and worst scenarios from a datasheet.
When used with the energyAware Profiler, the AEM system uses an ARM-based serial interface to collect additional information from the application. The data passed to it is decoded by the AEM system’s hardware and then passed to the PC. The non-intrusive nature of this activity means that the energy profile of the target is not altered in any way.
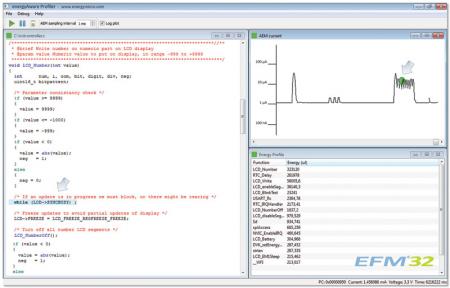
The additional data includes important debug information, including the Program Counter, which allows the energyAware Profiler to identify the source code being executed at a given moment in time as shown on the energy graph. This instantly gives the engineer a pointer to any part of the program with high energy consumption, allowing the code to be optimized to lower overall usage (Figure 3).
Figure 3
energyAware Profiler provides three simultaneous views: a graph of real-time application current consumption, an object code listing and an energy profile of individual application functions
The graph represents energy usage by the width and height of the trace: magnitude against time. It follows therefore that isolated peaks—which would be easily identified using an oscilloscope to monitor the power supply’s current—may not warrant further investigation, while long periods of relatively little activity could represent idle loops that could be easily replaced with an interrupt-driven event, allowing the device to enter an energy-saving sleep mode in the interim.
By seeing this information graphically represented and instantly correlated to the source code, the engineer is quickly able to identify, dismiss and prioritize specific routines within a program that could represent unnecessary energy usage. This can easily reduce the energy consumed by an order of magnitude.
It is commonplace for engineering teams to refer to datasheets when establishing the nominal power for a device or application. However, as intimated earlier, energy and power are simply not the same; many low-power devices use more energy because they are active over a long period of time. For this reason, the time axis for power management cannot be ignored but is rarely accessible in a reliable way.
Clearly in this scenario the software’s profile is crucial. Unfortunately, most software engineers are not aware of the extent to which code can be overtly ‘energy efficient’. This is not a criticism, it is an observation; software is not seen as inherently resource-hungry beyond the conventional terms of clock cycles and memory. However, today, every clock cycle used is power spent and minimizing that is a key challenge.
Furthermore, while minimizing clock cycles directly relates to less energy used, optimizing exactly when those cycles are used also gives a better overall energy profile. It is clear, therefore, that a functionally correct program is not necessarily optimized for energy efficiency by design.
The energyAware Profiler technology developed for the EFM32 Gecko MCU has a dynamic range from 0.1µA to 100mA, and fine-tuning of the application should be carried out at the same time as functional debugging to maximize results.
Energy debugging and software profiling are becoming more crucial to ultra-low-power development. While the EFM32 Gecko MCU is an inherently low-power technology, maintaining lower energy usage is intrinsically linked to the application’s performance over time. This makes it transient and subject to application-specific conditions and as such it is difficult to simulate. While a datasheet may give an engineer a good idea of the amount of power a device uses under given conditions, it is not until the application is actually running that the datasheet figures are really tested.
With experience and enough time, engineers would be able to develop code that is functionally correct and energy-optimized, but with the help of energyAware Profiler, that time and expertise is reduced significantly. The use of low-power technology, coupled with an energy profiling solution, means engineering teams are now better equipped to tackle the challenge of designing truly low-energy solutions.
Energy Micro’s chief technology officer Øyvind Janbu has more than 11 years of semiconductor experience in research, development and management. He was a contributing editor for the IEEE 802.15.4-2006 wireless PAN standard and holds a MSEE from NTNU in Trondheim, Norway.
Energy Micro AS
PO Box 4633
Nydalen
N-405 Oslo
Norway
T: +47 23 00 98 00
W: www.energymicro.com


