Design and manufacturing unite to tackle process variability
Analyses made by semiconductor manufacturers have demonstrated that maintaining pattern fidelity is critical, and that this task faces increasing limitations at the 65nm process node and below. At these technology nodes, even the most advanced resolution enhancement technologies (RET) have a difficult time with certain layout topologies. When the impact of this is observed across the process window, we can see that these layout topologies are encountering catastrophic failures. The impact of ‘process variability’ is one of the main problems plaguing both designers and manufacturers who are seeking ways to improve initial yields, accelerate stable yield ramps, and increase mature yields.
Accounting for process variation
At each stage in the design process, we use various metrics to gain insights on how process variation impacts manufacturability. For example, a designer working with SPICE models would look at a process/voltage/temperature (PVT) window, while a lithographer would look at a process window to see how dose, mask CD, focus and alignment affect how consistently a layout topology prints.
The two metrics are not completely unrelated; the PVT window takes into account the baseline lithographic process window. However, a PVT window provides no insight into the fact that the effects of the lithographic process window are not static. In fact, the effects of variability change considerably from feature to adjacent feature. This is why in nanometer designs, a strict design rules checking (DRC) based approach to modeling process requirements cannot entirely account for or predict the effects of lithographic process window variation.
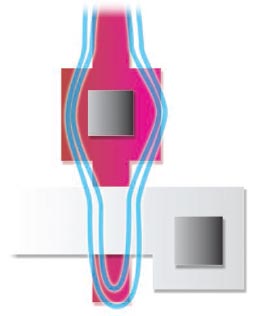
Figure 1. Close-up of a PV Band on a poly gate: in Grey, active layer; in Red, poly layer; in Blue, PV Band of the poly layer.
Both designers and manufacturers realize that modeling process variability is not a new concept. DRC was created to ensure that layout specifications met the requirements of manufacturing through pass/fail rules, and SPICE models have been used to characterize devices for simulation and timing checks. The role of DRC, along with parasitic extraction and simulation, has grown as the challenge of achieving acceptable yield at nanometer nodes has intensified. It is now employed to analyze and manage the many new effects and interdependencies that encumber the path to a clean sign-off. Such effects include the copper manufacturing process, metal fill, via insertion, planerization, antenna effects, and wire spreading. However, an unintended and undesirable resulthas been that design and DFM rules and models have grown exponentially with the introduction of each process node, making sign-off ever more complicated and time-consuming.
Currently, designers working at 90nm or 65nm are not only applying advanced DRC, but typically also work with foundry-recommended rules. These offer data on areas of the layout that can be modified to improve yield. While these methods surely increase the odds of improving yield, DFM methods must offer foundry data that includes details about how a particular design will manufacture given the specific process. This capability is the key benefit of an advanced DFM technology known as litho-friendly design (LFD).
Litho-friendly design concepts
To proactively design for variability, we must create an infrastructure that allows for the simulation of manufacturing effects across the process window. But how can such an infrastructure succeed given the ‘chasm’ that is said to stand between design and manufacturing? Only by adopting methods that leverage manufacturing data and avoiding methods that produce inconsistencies and inaccuracies.
LFD gives users the ability to improve yield by creating a design that is less sensitive to variations in a given manufacturing process. By capturing information on process window effects, designers can improve the layout to gain more control over manufacturing results. Using LFD, a layout designer can predict the effects of process variation on the printability of a specific chip, which makes it possible to design for improved robustness so that it is much less sensitive to process window variations.
A litho-friendly design checking performs three important tasks:
- Gathers data about how the design will perform at a range of possible dose/focus conditions, not just at the optimal settings;
- Predicts specific failures or potential yield inhibitors;
- Assigns each portion of the design a manufacturability score that reflects how well that portion will manufacture given the specific process window.
Figure 2. Advanced LFD tools use process variation (PV) bands that predict failure in common configurations including area overlap.
Data about the layout and its likely response to manufacturing variations is gathered through advanced techniques that incorporate process variation (PV) bands. A PV band is a geometry that shows how printing responds to process variations. It represents the area within which a feature will print as the process conditions vary. The band is generated by calculating the silicon-printed image at the various process conditions and then combining resulting images (Fig. 1 and Fig. 2). It is necessary, in order to create the PV band, to create an intermediate layer: the post-RET layer. This layer will then be simulated to create the silicon printed images.
The PV band enables yield failure prediction for several configurations, including the four most common: pinching, bridging, area overlap and CD variability. The predictions of configurations are compiled into LFD rules, and these are what the designer uses during the design process to analyze the flagged areas. LFD failure rules identify areas where variation in printing in response to process variation is likely to cause critical errors from a manufacturing, timing and power stand point. While typical design-rule violations can be fixed by edge movement (compacting features) or morphological (clipping corners) changes, LFD rules most often require topological changes.
Adopting LFD in the design flow
At first glance, an LFD flow may sound overwhelming for designers. Very few, if any, have lithographic knowledge or experience. That is why it is important that data is presented in a manner that can be easily incorporated into the layout and design flow. Ideally for designers, a LFD tool plugs into their flow much like an iterative design step, using the same layout editor as for the initial design.
Figure 3. The Design Variability Index (DVI) provides data that helps the layout designer make decisions about which configuration makes the design more robust to process variation.
Providing the data for an LFD flow is another matter. Until now, foundries were reluctant to cross the chasm with data for fear of exposing intellectual property (IP), especially in cases of a foundry-fabless business model. Fortunately in the last several years, encryption technology has come to market that enables the ‘safe’ exchange of foundry data. The foundry has the capability to decide what is encrypted without blocking the data that allows the designer to proceed with an accurate and valuable simulation, which includes recommendations about areas in the layout where modifications would be most likely to improve yield.
Finally, to make this data accessible and intuitive to a designer, foundries need to present it in a useful and familiar form that can be easily understood and manipulated by designers, perhaps much in the way DRC is currently presented. Litho-friendly design relies on an ‘LFD kit’ that encompasses energy and dose considerations, RET recipes, process models and parameterizable rules to be checked. The library of elements invocated by the flow can be compiled and encrypted to protect the IP in the foundry’s manufacturing recipe.
With the LFD kit, designers can run simulations to see how their layout will perform under a particular lithographic process window. The simulation results can include recommendations about areas in which modifications would be most likely to improve yield. By being consistent with a current physical verification platform, designers can use a layout viewer/editor and a results viewing environment, such as Calibre RVE or Calibre DESIGNrev, to view the check results and variability databases. Modifications to the layout can be made in the native layout environment, much in the way design iteration loops are done now.
An advanced LFD product should also provide an index from which the layout designer can make trade-off decisions. This Design Variability Index (DVI) captures variability in order to make the design more robust to process variations. The goal is to try to lower its value – i.e. the lower the number, the lower the variability. The flow or methodology will use this index compare different layout implementations and select the one with the least variation (Fig. 3).
Figure 4. An LFD iteration loop can easily fit into a standard cell, custom, analog or other design flow.
The LFD kit, not the designer, will be aware of the details pertaining to pattern transfer at the foundry, including OPC. Only the effects of the processes are shown to the designer. Simulation information will be presented to the designer much in the way DRC rules are presented now, with data that can be classified and sorted within the design environment. The data will also include comments for possible solutions.
As designers become used to working in LFD mode, they will learn what design elements will respond favorably to manufacturing processes. In time, users will design in a preventive mode – i.e. they will naturally practice manufacturing process-aware design. The goal of achieving a ‘DRC clean’ design will transform into a goal of achieving a ‘DRC and LFD clean’ design. And on the foundry side, yield managers will be able to minimize OPC issues and masks will be easier to make.
Because yield-aware design can be performed iteratively, and interactively, it fits well into any existing design flow, whether it is standard cell, custom or chip assembly (Fig. 4).
Summary
In this era of shrinking geometries, fine line interconnects and sensitive manufacturing processes, the task of achieving acceptable yield on a silicon wafer has become more and more elusive. At the 0.35μm and 0.25μm nodes, designs can generally be manufactured as drawn and yield outcomes can be stabilized quickly. But for nanometer designs, it is difficult to reliably print the image intended by the designer, let alone gain a reasonable ramp up to acceptable yield rates. At the 180nm process node, it became mandatory for foundries to apply RET to the design in order to attain working silicon; at 130nm and below, successful manufacturing is even more impossible without it. This task is not only demanding under nominal conditions but is also proving a bigger challenge in maintaining pattern fidelity across process variations.
Process variability will always be a reality in manufacturing, although the impact of such variability can be minimized as those effects can be modeled. But capturing process variability to improve layout robustness is a major new step in design for manufacturing. For standard cell, IP providers, and chip designers, using incorporating LFD in the design flow is a way to prevent possible yield issues from becoming problems and positively contributing to the overall yield outcome. With the work being done today towards the goal of creating LFD-clean designs, a foundation is being established for managing the impact of yield inhibitors with each new process node. Before, yield control was mostly in manufacturers’ hands. With an LFD flow, the designer can help prevent yield loss and improve the conditions that can lead to higher levels of yield.
Mentor Graphics
Corporate office
8005 SW Boeckman Rd
Wilsonville
OR 97070
USA
P: +1 800 547 3000
www.mentor.com