Shadow model and coverage driven processor verification using SystemVerilog
This paper describes a random test generation strategy we are using to complement the verification of upcoming generations of processor. SystemVerilog provided the means to define the functional coverage of our design and to employ the shadow modeling technique, significantly improving our verification flow. Shadow modeling is a reliable method for proving the functionality of the design, because different engineers implement the reference model and the RTL, and it is very unlikely that two distinct teams, using two different programming languages, will implement the same errors in the same way.
The functionality of the microprocessor is already comprised in its reference model (i.e., the instruction set simulator). The ISS is considered to be a running specification of our microprocessor. Although it was not conceived for use in hardware verification, we are leveraging the investment spent on its creation for this purpose. In this way, we gained time – otherwise invested to conceive and implement direct tests for difficult corner cases – to specify and implement the functional coverage of the design. Our verification software not only substantially improved the verification flow, but also now gives us virtually unlimited opportunities to further enhance the verification of the system.
1. Introduction
In earlier generations of Hyperstone microprocessors, we used self-checking directed tests as our main approach to functional verification. In conjunction with booting the OS and running some application programs written in C, this was considered sufficient. As the architecture became more complex, many more test cases had to be covered. So, we supplemented existing verification methods with random test generation and automated result checking.
Three independent tasks must be implemented to employ this verification methodology:
- Random test generation: a stream of random instructions, properly constrained so they do not put the microprocessor into an illegal state.
- Reference modeling: a ‘golden’ model used to ensure that the random test run produces the correct results. The model runs the same test and generates reference results used for comparison in simulation.
- Functional coverage: a mechanism that measures the functional coverage of the random tests generated because, unlike with directed test, we do not know in advance what is being tested and what is not.
These tasks can be implemented in many ways. The next sections describe how we implemented our verification system based on random test generation and automated result checking.
2. Improving the verification environment
Our original verification environment was based on a simple test-bench that instantiated the processor RTL code and its behavioral memory models. We had a regression suite based on directed tests that was combined with the boot simulation of the Hyperstone real-time kernel and other application programs.
As our architecture became more complex, many more test cases had to be covered. So we added random test generation and automated result checking. A good random test generator can generate tests to cover different addressing modes, instruction combinations, pipeline issues, and so on.
Our approach was initially based on perl scripts generating con-strained random assembly code. This was assembled to create a loadable memory image of the test for the RTL simulation. The same test had to run in a reference model prior to the RTL simulation to generate the reference result files. This reference model was a behavioral instruction set simulator (ISS) written in C. During the simulation, these files were loaded and used for comparison with the main RTL results. On a mismatch, the simulation was immediately stopped. To address functional coverage, we used the PSL cover directive to cover properties defined in the instruction register (IR).
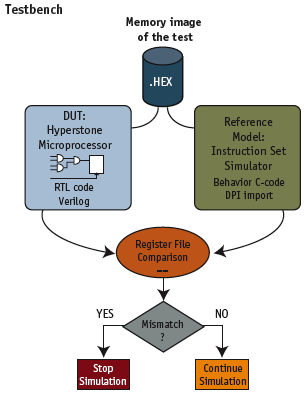
Figure 1. Shadow modeling
This resulted in an over-complicated verification flow. Automation was cumbersome and testing was limited to the amount of memory in the system. The longer the test, the bigger the reference file, and the file IO usually slowed down simulation performance. Because of the limited test duration, we had to start several simulations, merge the functional coverage database, and decide if we needed to start a new simulation or not.
We decided to use shadow modeling to improve the flow. This entails integrating the reference model in logic simulation. As a result, we no longer needed to run tests in the ISS to generate reference files for the RTL simulation. The results were generated in simulation on-the-fly by the ISS. To integrate the ISS in logic simulation, we used SystemVerilog’s direct programming interface (DPI).
Additionally, we substituted the perl scripts with verification soft-ware written in C. In simulation, instead of loading a memory image of the test containing the random instructions, we now load the cross-compiled verification software. While executing the software, the processor generates on-the-fly random machine code, copies it into a memory segment, branches to this segment, and executes the just generated code. After finishing execution, it repeats this loop over and over again. We are no longer limited by system memory size. Software running in the device-under-test (DUT) generates and executes its stimuli indefinitely.
We used SystemVerilog constructs to define and monitor the functional coverage. Thus, our software could be run indefinitely until it automatically reached the coverage goals. (see Section 4)
In summary, the verification flow has been simplified to:
- Compile the verification software into a loadable memory image.
- Simulate the execution of the verification software until it reaches coverage goals.
Another advantage here is that the verification software is aware of the processor state and can, on its own, steer the direction of the tests it creates. Previously, we were not generating tests on-the-fly but in advance and then simply running them in the microprocessor. These tests had no intelligence: they were simple random code, blindly executed to perform result comparison with the reference model. Now, there are virtually no limitations on how we improve the software(e.g., building intelligence to better constrain the stimuli).
3. Result checking using shadow modeling
Random instruction generation can only be used in verification if the same stream of instructions is run on a reference model and the results compared against the RTL implementation. To perform our result checking, we used ‘shadow modeling’. With this technique, a reference model is simulated in parallel to the DUT. Every time the DUT completes an instruction, the reference model is assigned to execute the same instruction. When the reference model finishes executing this instruction, the two results are compared and mismatches flagged. For verification, the reference model can be an ISS or a cycle-accurate model of the microprocessor. The results are snapshots of the microprocessor’s internal register file, which are written every time an instruction is executed. Figure 1 depicts our system.
3.1 The Reference Model
We used an existing ISS as our reference model. It was a non-cycle accurate simulation model of the Hyperstone E1-32X microprocessor written in C. It simulates not only the full instruction set architecture (ISA) but also memories and peripheral circuits. After every instruction is executed, its entire register file is saved in a set of variables. Programs are run sequentially; no instruction pipelining nor any timing of the E1-32X at the hardware level is modeled. The fact that the ISS is not cycle-accurate presents some challenges, discussed in the next subsection.
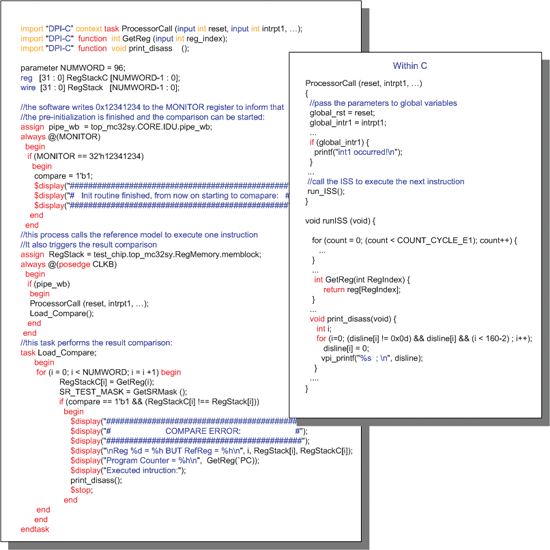
Figure 2. Testbench – checking the results
3.2 Integrating the shadow reference model
To integrate our reference model for HDL simulation, we used the SystemVerilog DPI. It simplifies the task of integrating C-code in logic simulation and offers very good simulation performance. For the ISS integration, we wrote an interfacing function in C to hold and transmit the required parameters to the actual ISS. We imported this C function to the testbench with the following statement: import “DPI-C” context task ProcessorCall (input int reset, input int intrpt1, … , input int pin1,…);
Once integrated in simulation, the ISS acts like a slave of the test-bench. When called, it takes control of the simulation to execute one single instruction. When this is finished, it gives control back to the logic simulator. Instructions executed by the ISS do not consume simulation time. The ISS is not cycle equivalent to the real system: multi-cycle instructions (e.g., DIV and MUL) are executed in a single call. Interrupts are reported to the ISS on every call.
To perform result checking, the DUT and the ISS must run synchronously. We cannot call the ISS at every clock cycle to execute an instruction because multi-cycle instructions report their results immediately and the program counter (PC) is then actualized, resulting in a loss of synchronization. So, we created a signal in the microprocessor’s RTL code that signals when an instruction has finished its execution and has the results written back to the register file. We named this ‘flag pipe_wb’ (i.e., pipeline write back) and it triggers the call to our ISS.
3.3 Checking Results
To check results, we use the DPI to import an existing ISS function that returns the current value of a register in the microprocessor’s register file. We imported this C function to the test-bench with the following statement: Import “DPI-C” function int GetReg (input int reg_index); After the ISS is called to execute an instruction, we call a Verilog task that loops all registers comprised in the microprocessor register file and compares their contents to those generated by the reference model. There are exceptions that require special handling. For example, the results of a LOAD instruction will not immediately be used in the subsequent instruction as a source operand. This LOAD may take several clock cycles to conclude its execution, and as long as its result is not required in the current instruction, the processor does not block the program execution. Yet the ISS does not model this behavior; the result is immediately written to the destination register. Therefore, we built a mechanism that prevents the comparison of this register until the result is also available in the DUT.
Before we can compare the registers, we have to pre-initialize them in software. Since both DUT and ISS run the same test program, they are initialized equally. After initialization, the processor writes a value to a memory-mapped register in the testbench to signal that initialization is finished and comparison can start.
Figure 2 illustrates a simplified version of the testbench. Lines 0-2 show import declarations for the C functions of the reference model, or ISS (we had to import ‘ProcessorCall’ as a ‘context task’ because it calls our ISS, which in turn calls other functions). Lines 10-20 depict code where the testbench waits until the software finishes the initialization of all registers in the processor’s register file. The processor then writes the value 0x12341234 to the ‘MONITOR’ register, which is memory-mapped to the microprocessor. This sets the signal compare to 1’b1, enabling the actual register comparison in line 38. Lines 24 -31 depict the actual result comparison. The signal ‘pipe_wb’ flags when an instruction has written its results in the processor’s register file. This triggers the call of the reference model (‘ProcessorCall’) so that it can execute the same instruction and keep in synch with the DUT. The passed parameters are assigned to global variables of the ISS before the ISS main function is called to resume the program execution. Before the function returns, the ISS saves its state in an array of global variables (‘reg[RegIndex]’). Lines 33-51 depict the task ‘Load_Compare’, which loops all registers contained in the processor’s register file and compares the contents to those generated by the reference model.
4. Functional coverage
Functional coverage measures the functionality exercised in the design and, properly defined, helps indicate the completeness of the verification plan. It also helps engineers to identify untested parts of the design and concentrate on reaching the verification goals within the optimal number of simulation cycles.
We employed SystemVerilog to specify our functional coverage models as it provides many extensions to facilitate the specification, computation, and monitoring of a system’s functional coverage. One important coverage goal was to ensure that all instructions were tested in their most important modes. We used coverage groups to specify the functional coverage of our entire instruction set architecture (ISA). The Hyperstone microprocessor has variable-length instructions of 16, 32, and 48 bits. The next two subsections explain how we used coverage groups to specify functional coverage of the instruction MOV of the Hyperstone ISA.

Figure 3. RR instruction encoding

Figure 4. MOV functionality
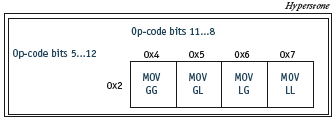
Figure 5. MOV encoding
4.1 Specification for the MOV instruction
The MOV instruction is a 16-bit instruction of format ‘RR’, that means it accepts global (i.e., G0…G15) or local (i.e., L0…L15) registers as both destination and source operands. Figure 3 depicts how instructions of type ‘RR’ are encoded in the instruction register (IR).
In a MOV instruction, the content of a source register is copied to the destination register, and the condition flags are set or cleared accordingly. Figure 4 depicts its functionality. ‘Z’, ‘N’, and ‘V’ refer to the zero, negative, and overflow flags, respectively.
The encoding scheme for the MOV instruction is depicted in Figure 5. For example the assembly instruction ‘MOV G3, L2’ produces the machine code ‘0x2532’, where the op-code ‘0x25’ indicates that it is a MOV instruction that has a global register as destination and a local register as source. The remaining byte ‘0x32’ is the concatenation of Rd-code and Rs-code and indicates that the register indexes are ‘0x3’ for the destination and ‘0x2’ for the source.
4.2 Functional coverage
for the MOV instruction To specify the functional coverage model for the MOV instruction, we used the code in Figure 6. This counts how many times all the variants of the MOV instruction have been executed.
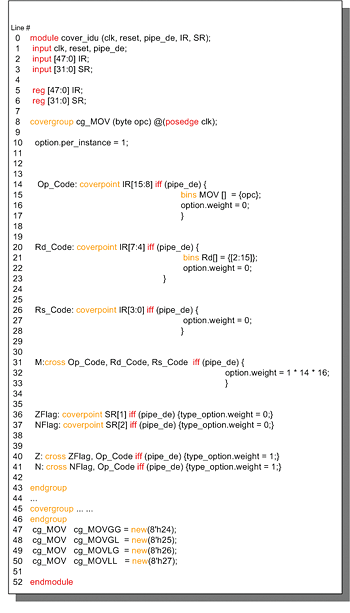
Figure 6. Covergroup for MOV instruction
To collect the coverage information, we defined the coverage group ‘cg_MOV’. We created three coverage points associated with the signal IR, and two coverage points associated to the status register (SR). We also had to create instances of the coverage group using the new operator (lines 47-50).
The Questa verification software starts counting the number of times the signal is sampled with each of its possible values and stores these values in bins. If we do not explicitly define bins for the coverage points, they are implicitly created to account for every possible value. If we are solely interested in a subset of values, we have to explicitly declare bins for them.
The coverage points relative to IR create counters for all sub groups of the IR (i.e., Op-Code, Rd-Code, Rs-Code). We set the option weight to zero in all coverage points because we are not directly interested in the individual evaluation of these coverage points, but their cross-coverage. We also created two coverage points associated with the bits of the SR that represent the zero and negative flags (line 36 and 37, respectively).
The cross-labeled ‘M’ (line 31) generates counters for all possible simultaneous coverage point hits, providing the actual information on which instructions have been correctly decoded and executed. For example, in the instance ‘cg_MOVGG’ (line 47) the cross coverage for ‘Op_Code’, ‘Rd_Code’, and ‘Rs_Code’ contain 224 bins (1 * 14 * 16) accounting for all possible variations of that instruction: ‘MOV G2,G0’; ‘MOV G2,G1’; ‘MOV G2,G2’; and so on.
The crosses labeled ‘Z’ and ‘N’ (line 40 and 41) show which status flags have been set during the execution of the MOV instructions.
The signal ‘pipe_de’ informs us that the IR has been decoded and will be executed. We used the ‘iff’ construct to disable coverage when this signal is false at the sampling point.
The coverage group has a formal argument for instantiation (i.e., opc of type byte). It allows us to instantiate the coverage group four times to cover all possible types of MOV instructions. It also allows us to request individual coverage information for each instance.
4.3 Monitoring functional coverage
To monitor functional coverage, we used the ‘$get_coverage()’ system task, which retrieves a weighted average of all defined covergroups, coverpoints, and crosses in the design. To finish the simulation we used: if ( $get_coverage() >= `cover_goal ) $finish;
We can also monitor the instance coverage using ‘get_inst_coverage()’.
This method gives the weighted average of all covergroupbasedcoverage in the specific instance. For parameterized coverage groups, as in our example, it is necessary to use the option ‘per_instance’, as depicted in line 10 of Figure 6.
Hence, the individual coverage for an instruction of type MOVGG can be retrieved with: cg_MOVGG.get_inst_coverage()
The ability to monitor individual coverage of all instances gives us important information that can be used in the verification software as constraints for random test generation.
5. The verification software
Initially, we used perl scripts to generate random assembled code, then assembled it to generate a loadable memory image of the desired test. Due to memory limitations, we had to run the perl script several times with different seeds to generate enough tests that satisfied the functional coverage goals. To improve the verification flow, we wrote a piece of software that incorporated the generation of random stimuli implemented in the perl scripts. We wrote verification software in C and assembly language and cross-compiled this to the microprocessor. The loadable memory image of the test was then simulated to perform the following actions:
- Initialize the microprocessor.
- Initialize the entire register file for result checking.
- Generate constrained random machine code.
- Copy the generated machine code into a memory segment.
- Branch to that memory segment and execute the just generated machine code.
Three, four and five are performed repeatedly until functional coverage goals are reached and the testbench finishes the simulation.
Figure 7 (p28) depicts a simplified version of the verification software used to generate random stimuli. Here, we simplified the program to handle only MOV instructions. The program as depicted is still fully functional.
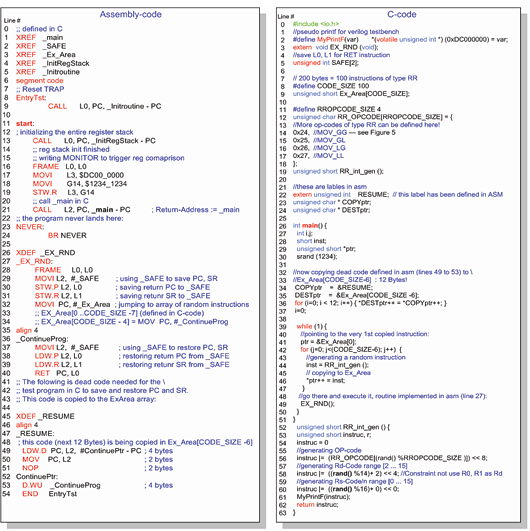
Figure 7. Software – simplified example for MOV instruction
The op-code constructs are stored in an array, ‘RR_OPCODE’ (lines 12-18, C code). They generate the random instructions. There is also an array, ‘Ex_Area’ (line 9, C code), where the generated instructions are copied before execution.
The function that is called to start execution of the random generated instructions is ‘EX_RND’ (line 27, assembly code). It saves the return PC and SR to memory and branches to the array ‘Ex_Area’, where all generated instructions are stored.
The assembly code in lines 49 -53 is copied to the last elements of ‘Ex_Area’. This ensures that the very last executed instructions redirect the PC back to line 37 in the assembly code. The return PC and SR are restored, and the routine returns from where it was called (i.e., line 49, C-code).
After the pre-initialization of the processor’s register file (lines 11-19), the program is redirected to main (line 26, C-code). First, the main routine copies the assembly code (lines 49 -53) to the end of ‘Ex_Area’. Then an endless loop is executed, where the processor generates random instructions, copies them to ‘Ex_Area’, and branches to ‘EX_RND’ to execute them.
The function that generates random instructions is called ‘RR_int_gen()’ (line 52, C-code). It uses the function ‘rand()’ to randomly pick one of the op-code constructs from ‘RR_OPCODE’. The only constraint we have for the generation of the MOV instructions is that we are not using the indexes 0 and 1 as destination registers (line 58, C-code). These registers are actually PC and SR, and we do not want to overwrite them.
6. Debugging the system
The verification environment is quite heterogeneous. It comprises the RTL design written in Verilog, a reference C-model (i.e., the ISS), and the verification software written in assembly and C. Every element of the system can be effectively debugged using different approaches.
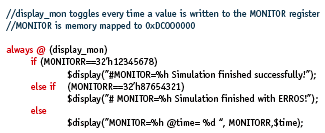
Figure 8. Verilog code implementing pseudo printf
6.1 Debugging the RTL
Mentor Graphics’ Questa suite provides extensive features to debug Verilog and VHDL code. The most commonly used tool for hardware debugging is still the waveform viewer. One can also use the Verilog $display system task, set breakpoints in the RTL code, run it in step mode, and so on.
6.2 Debugging the RTL/C-model interfaces
The most common problem with the C interfaces occurs when parameters are erroneously passed through the DPI or not passed at all. Matching type definitions are the user’s responsibility; no warning is issued at compile time if the argument passing is not correct. A useful way to debug the interfaces is to scatter ‘printf ’ commands throughout the C function to print out messages and arguments. Questa’s ‘vpi_printf ’ routine can be used to get messages printed out in the Questa TCL shell. You can also use ‘#ifdef ’ directives to conditionally compile different levels of debugging information.
Debugging with ‘printf ’ can get very tedious. You have to put in all those statements and then comment them out after fixing any problems. Of course, you have to recompile every time you make changes. Questa provides an integrated gnu debugger for C code debugging. This allows you to debug the source code of your C-models in the same way you debug RTL source code.
6.3 Debugging the verification software
Logic simulators normally do not provide visibility into the assembly code driving the processor at a specific time in simulation. But you can display the IR along with the program counter in the waveform, and, if you know your ISA encoding well, assess how the machine code being executed correlates with the source code. If you do not know the ISA encoding intimately, you can refer to the documentation, but debugging loops will be longer.
One alternative is to include memory-mapped registers in the test-bench. You can display the contents of the values written to these registers, and use these monitor registers to determine which part of the software is being executed and whether the simulation is going as expected. The monitor registers implement a pseudo ‘printf ’. In software, we define the printf in the following way: #define MyPrintF(var) *(volatile unsigned int *) (0xDC000000) = var;
Note that we use the keyword ‘volatile’ to prevent the compiler optimizing away several consecutive writes to this same monitor register. In assembly, we can use macros to do the same job. A second alternative is to have the ISS output a log file with the disassembly of the executing software. You can even import the ‘disass’ function of the ISS with the DPI and call it on ‘pipe_wb’ to print out the executed instruction in the simulator TCL shell.
In normal operation, our software runs indefinitely. To avoid huge log files, we have implemented a circular buffer that restricts the report to a defined number of last executed instructions. In this way, when a compare mismatch occurs, we can still reproduce the test case on an additional simulation in GUI mode.
In conclusion, we substantially improved the verification flow, and secured virtually unlimited opportunities to enhance it. For instance, we have developed an algorithm that samples coverage information from memory-mapped registers in the testbench and uses this to constrain the random generated instructions. Currently, this algorithm replaces the op-code constructs of fully covered instructions with the op-code of the least covered, so that the generator is more likely to use them. Experiments show runtime gains of 20%.
Hyperstone
Line-Eid-Strasse 3
78467
Konstanz Germany
T: +49 7531 98030
W: www.hyperstone.com