Smaller designs face greater risk of respins
Research study suggests the maturity of your verification flow determines the likelihood of first-pass success far more than the complexity inherent in design size.
For nearly 10 years, Mentor Graphics has commissioned the Wilson Research Group Functional Verification Study. This is a multiple worldwide, double-blind, functional verification study, covering all electronic industry market segments.
The results from the most recent study in 2014 shed some light on the pressing question of the impact of design size on the likelihood of achieving first-silicon success. If your assumption right now is that the bigger the design, the greater the respin risk, get ready to be surprised.
Time spent in verification
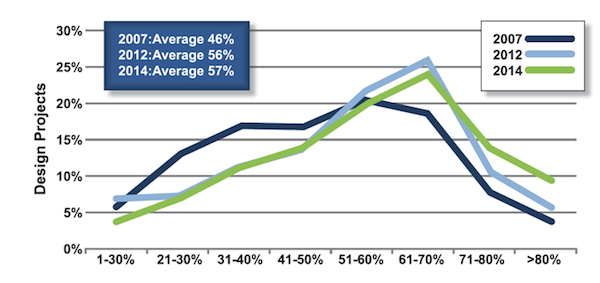
Our industry is experiencing growing resource demands due to rising design complexity. Figure 1 shows the percentage of total project time spent in verification. As you would expect, the results are all over the spectrum: where some projects spend less time in verification, other projects spend more.
The average total project time spent in verification in 2014 was 57%, no significant change on 2012. That said, notice the increase in the percentage of projects that spend more than 80% of their time in verification.
Verification productivity and designer headcount
Perhaps one of the biggest challenges in design and verification today is identifying solutions that increase productivity and control the engineering headcount. To illustrate the need for productivity improvements, let’s consider the issue in terms of that headcount.
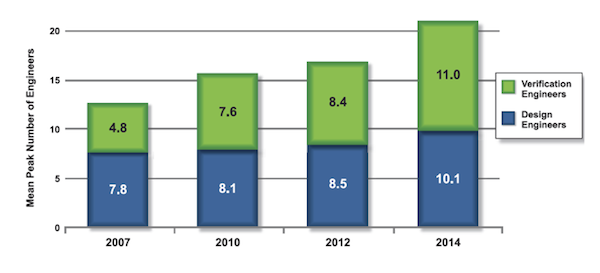
Figure 2 shows the mean peak number of engineers working on a project. Again, this is an industry average and you need to recognize that some projects have many engineers while other projects have few.
You can see that the mean peak number of verification engineers today is greater than the mean peak number of design engineers. In other words, there are on average more verification engineers working on a project than design engineers. This situation has changed significantly since 2007.
Another way of understand the implications of today’s project headcount trends is to calculate the compound annual growth rate (CAGR) for both design and verification engineers. Between 2007 and 2014 the industry experienced a 3.7% CAGR for design engineers but a 12.5% CAGR for verification engineers. Clearly, that verification-based double-digit increase is a major cost-management concern, and an indicator of a growing verification burden.
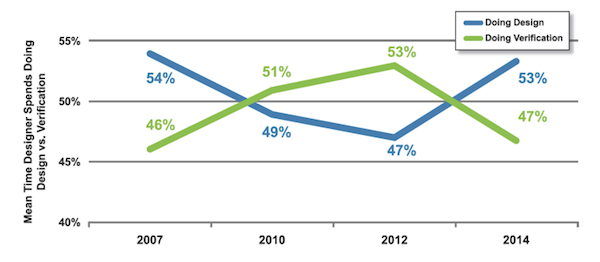
Moreover, verification engineers are not the only project stakeholders involved in the verification process. Design engineers spend a significant amount of their time in verification, as shown in Figure 3. In 2014, design engineers spent on average 53% of their time involved in design activities and 47% in verification.
As you can see, the 2014 result reverses a trend observed in 2010 and 2012. Then, the indication was that design engineers were spending more time in verification than design. Today’s data suggest that the design effort has risen significantly in the last two years when you take into account that: (a) design engineers are spending more time in design; and (b) there was a 9% CAGR in required design engineers between 2012 and 2014 (shown below in Figure 4). That is a steeper increase than the overall 3.7% CAGR for design engineers between 2007 and 2014.
Verification tasks
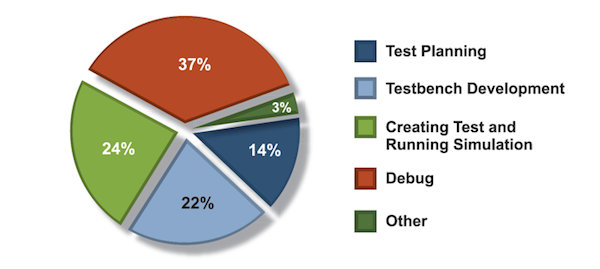
One factor contributing to this increase in demand for design engineers relates to the complexity of creating designs that actively manage power. Figure 4 shows where verification engineers spend their time (on average). We do not show trends here because this aspect of project resources was not studied prior to 2012 and there was no significant change in the result in 2014.
The latest study found that verification engineers spend more of their time in debugging than any other activity. This needs to be an important research area if we are to find the future solutions necessary to improve productivity and predictability.
Minimizing design spins
Today we find that a significant amount of effort is being applied to functional verification. An important question our study has tried to answer is whether this increasing effort is paying off with respect to design schedules and number of required spins.
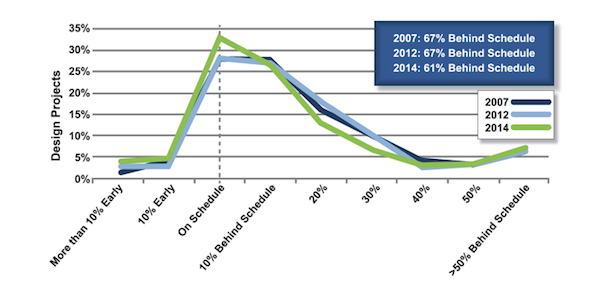
Figure 5 presents design completion time compared to original project schedules. The data suggest that in 2014 there was a slight improvement. In the 2007 and 2012 studies, 67% of projects were behind scheduled, but in the latest survey this drops to 61%.
It is unclear if this improvement is due to managers becoming more conservative in their project planning or simply better at scheduling. Regardless, meeting an originally planned schedule is still a challenge for most of the industry.
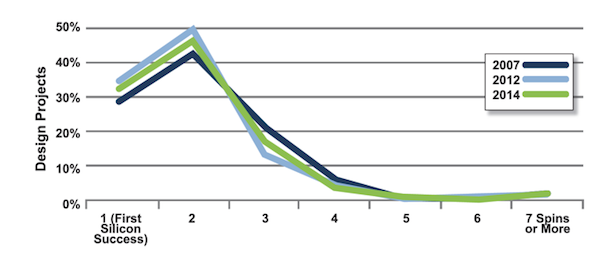
Figure 6 shows the industry trend in the number of spins required between the start of a project and final production. Even though designs have increased in complexity, the data do not suggest that this metric is getting any worse. Nevertheless, only about 30% of today’s projects achieve first silicon success.
It’s generally assumed that the larger the design, the larger the likelihood of bugs. Yet, a question worth asking is how effective project teams are at finding these bugs prior to tapeout.
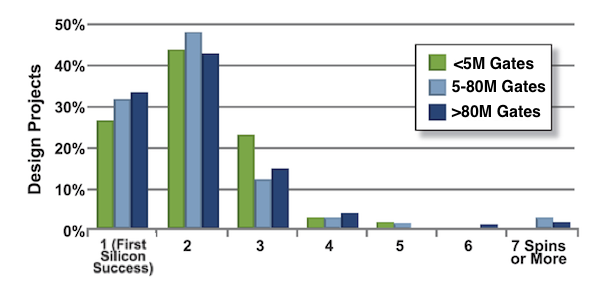
To create the results in Figure 7, we first extracted the 2014 data for the required number of spins trends presented in Figure 6, and then partitioned it into sets based on design size (that is, designs less than 5 million gates, designs between 5 and 80 million gates, and designs greater than 80 million gates). This led to perhaps one of the most startling findings from our 2014 study.
The data suggest that the smaller the design, the lower the likelihood of achieving first silicon success.
While 34% of the designs over 80 million gates achieve first silicon success, only 27% of the designs less than 5 million gates are able to do so. The difference is statistically significant.
Verification maturity beats design size
To understand what factors might be contributing to this phenomena, we decided to apply the same partitioning technique to examining verification technology adoption trends.
Figure 8 shows the adoption trends for various verification techniques from 2007-2014. Specifically here we show adoption for code coverage, assertions, functional coverage, and constrained random simulation.
One observation we can make from these adoption trends is that the verification process is maturing. This maturity is likely due to the need to address the challenge of verifying designs with growing complexity.
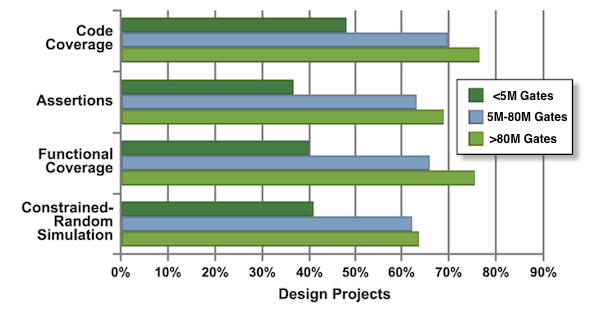
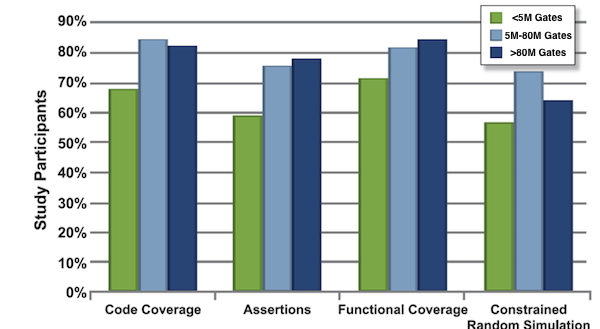
In Figure 9 we have extracted the 2014 data from the various verification technology adoptions trends presented in Figure 8, and then partitioned this data into sets based on design size (as before, designs less than 5 million gates, designs between 5 and 80 million gates, and designs greater than 80 million gates).
Across the board we see that designs with less than 5 million gates are less likely to adopt code coverage, assertions, functional coverage, and constrained-random simulation. If you then correlate this data with the number of spins by design size (as shown in Figure 7), the data suggest that the verification maturity of an organization has a significant influence on its ability to achieve first silicon success.
As a side note, you might have noticed that there is less adoption of constrained-random simulation for designs greater than 80 million gates. There are a few factors contributing to this behavior. Two of the most significant are:
- Constrained-random works well at the IP and subsystem level, but does not scale to the full-chip level for large designs.
- There are a number of projects working on large designs that predominately focus on integrating existing or purchased IPs. Hence, these types of project focus more of their verification effort on integration and system validation task, and constrained-random simulation is rarely applied here.
Conclusion
One immediate takeaway from the 2014 Wilson Research Group Functional Verification Study is that the verification effort continues to increase, resulting in a double-digit increase in the peak number of verification engineers required on a project.
Another is that the industry is maturing its verification processes as witnessed by the verification technology adoption trends.
However, we also found that smaller designs are less likely to adopt what are generally viewed as industry best verification practices and techniques. Similarly, we found that smaller designs tend to have a smaller ratio of peak verification engineers to peak designers.
Perhaps having fewer available verification resources, combined with the lack of adoption of more advanced verification techniques, could account for fewer small designs achieving first silicon success. The data suggest that this might be one contributing factor. It’s certainly something worth considering.
About the author
Harry Foster is Chief Verification Scientist for Mentor Graphics’ Design Verification Technology Division. He holds multiple patents in verification and has co-authored six books on verification, including Creating Assertion-Based IP (Springer 2008). Harry was the 2006 recipient of the Accellera Technical Excellence Award for his contributions to developing industry standards, and was the original creator of the Accellera Open Verification Library (OVL) standard.
