Acceleration homes in on power issues
Emulation and simulation acceleration technologies provide the means to more efficiently detect power issues before tapeout – and find the worst-case modes that need to be fixed.
The requirement for low-power operation is now found in almost every market and device. Battery life is critical to mobile but the power efficiency of large data centers has also become a major issue, demanding the verification of low-power operation in every SoC design.
The problem that faces design teams is establishing the power envelope for a device that may be able to enter many different modes of operation – how do you know whether the SoC will stay within its predicted envelope under all those conditions, especially if you only have limited time to simulate the design?
Adding power intent increases verification complexity. Take a simple design that uses four domains each with on/off states. This involves the simulation of multiple power modes that need to be exercised against functional tests. Each combination of domain in the on/off state needs to be tested against its expected functionality, which adds time to the verification phase.
In an archived webinar hosted by Cadence Design Systems, product engineer Joel Ake and Dieter Thuemmel, describe how emulation and simulation acceleration are two important tools in the war against excessive power consumption and can play a role at every phase of the design-verification lifecycle.
Run more cycles
Using simulation acceleration, it is possible to run many more cycles of RTL, exercising the design in its many modes against power intent. Following synthesis, the gate-level netlist and intent can be reverified with hardware assistance at higher speed than pure software simulation, allowing the use of techniques such as power gating, multiple voltage designs and dynamic voltage and frequency scaling (DVFS).
Thuemmel argues the danger of sticking with a software-only power-intent verification flow is that it can lull you into a false sense of security. “If you look at the traditional way of doing power analysis using simulation, you usually have the capability of running a limited number of cycles so you may just encounter a peak and think this is your power consumption cycle.”
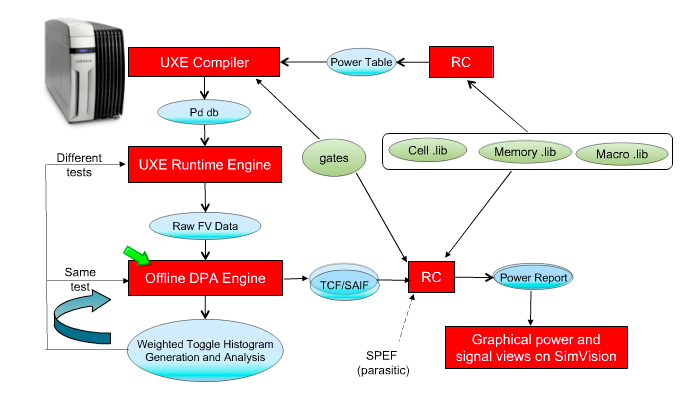
Image Gate-level design flow for dynamic power analysis
You may find much later, Thuemmel adds, that you only encountered a local maximum and there are conditions that lead to even larger peaks that may be far outside the predicted power envelope. By running fewer cycles, you limit the ability to home in the real peaks and find out what is happening in the system to lead to that situation. For example, you may find that modules that are meant to be power-gated have not actually been shut down because of a mistake in the control state machine or missing power states.
Peak finding and debug does not have to be run entirely on a hardware accelerator. You can divide the job of power debugging into two main activities. Thuemmel said using an emulator and hardware accelerator such as Palladium, it is possible to generate a histogram of SoC activity and then analyze that offline in a waveform-viewing tool such as SimVision.
Accuracy levels
A question for performing peak-power analysis is determining the level of accuracy needed to gauge how much power the SoC will draw under a given set of conditions. Power analysis is largely based on estimates of logic activity over time but by applying increasingly complex models of gate-level power consumption, a more accurate picture of power consumption can be built up.
Typically, accelerated power analysis is performed as a cooperation between a tool such as Palladium XP and power estimators. The Palladium XP emulator computes activity levels over time, storing them as toggle counts. This captured activity is used by a tool such as Cadence RC, which accesses the same netlist as that used by Palladium XP, to compute actual power consumption. Power analysis splits a time window into multiple segments. RC computes the power consumed during each segment to build a profile and then merges the segments to create an accurate power-estimation profile.
To provide accurate estimates for a given process library, the power estimator takes technology-library data from the associated Liberty files, which store power and switching activity values for each standard cell. The addition of SPIF-derived parasitic data provides highly accurate power-consumption results that can be provided in graphical form via SimVision and combined with the electrical waveforms generated during the simulation run on Palladium XP.
A power consumption estimate that includes all parasitics is not always needed. Very often, the toggle counts themselves can give a good early indication of where the troublespots are to be found in an SoC design. The more accurate power-estimation techniques can be used to home in on specific segments of time in the captured results.
Toggle measurement
Reports that can be generated include native toggle count, which is a simple histogram of the total number of toggles within each time step. This is very useful for capturing relative peaks. However, gates in high-voltage islands are likely to consume more power than those that might experience high activity but which are able to run at a lower voltage. Similarly a memory write-enable toggle event will result in higher power consumption that a toggle signifying a read from a NAND gate. For analyzing these effects, a system such as Palladium can generated a weighted toggle count.
For the highest level of accuracy, there is the TCF, which provides more detailed information on the types of toggle events in each cycle, and so offers support for the finest granularity of power estimation. Power data need not have the same granularity. Sub-instances can be compiled for power estimation while others are compiled without full power estimation to make the analysis more performant.
“Activity generation is very fast. TCF can take a little longer,” said Thuemmel.
Armed with these tools, dynamic power analysis provides a way of identifying cases where the software may not be interacting with the power controller as well as it might. This type of debug work can be performed on a system such as Palladium XP using a combination of electrical waveform analysis and software debug. The platform supports the connection of debuggers such as ARM’s DS5 multicore debug engine. At the same time as performing interactive debug, it is possible to run power analysis to better understand the software impact on power as different domains are switched on and off under software control.
Ake said a key advantage of Palladium XP is that it is possible to save and restore test points so that engineers do not have to run through the boot sequence on each debug run but instead fast-forward to a point of interest and continue debug from there. A fast-compile mode allows the effect of ECOs on power consumption to be observed quickly, he added. Through the use of set, force and release commands, it is also possible to perform what-if analyses on the system to gauge the impact, for example, of power-gating a block without having to apply an ECO first.
Thuemmel said customers who have used the platform so far have reported their ability to detect unexpected power peaks and apply fixes that bring their designs back inside the power envelope well before committing to silicon. Some have reported thousand-fold power-intent verification speedups, letting them home in on power issues much more quickly.