High quality yield modeling is critical for DFM
Design-for-manufacturability (DFM) has become pervasive and there is general agreement on the need to apply DFM at multiple stages of the design cycle. DFM techniques at the relatively mature 0.13um technology node entail well known enhancements such as contact and via redundancy, line-ends and borders, and wire spreading. Mature technology nodes achieve product yields which, if the major systematics are already localized and addressed, are mainly random defect-limited and receive only an incremental benefit from this DFM set.
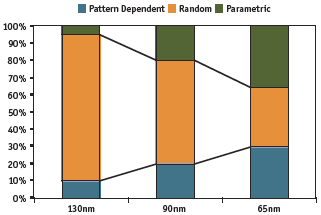
Mitigating the risk of a late product introduction at 90 and 65nm requires the knowledge that yield is now dominated by systematic yield loss (Figure 1). Process-design integration expertise and infrastructure are critical to proactively and efficiently reduce these manufacturing risks. Accurate yield modeling lies at the core of process-design integration and proactive DFM. Here, we discuss key characteristics of accurate yield modeling required to obtain maximum benefit.

Figure 1.Contributions to yield loss in 90nm and 65nm technologies1
Mitigating the risk of a late product introduction at 90nm and 65nm requires the knowledge that yield is now dominated by systematic yield loss (Figure 1). Process-design integration expertise and infrastructure are critical to proactively reduce these manufacturing risks in a way that can be efficiently quantified and implemented.
Accurate yield modeling ies at the core of process-design integration and proactive DFM. Here, we discuss key characteristics of accurate yield modeling required to obtain the maximum benefit from DFM.
Typical yield models
At 90nm and below, accurate yield models must be calibrated with both random and systematic yield loss mechanisms.

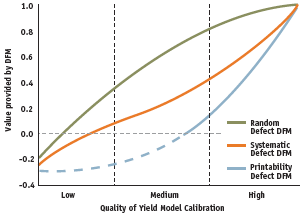
Figure 2. Yield model quality drives the value from DFM
There are many approximations of yield that include the dominant silicon IP (SIP) content of most SoC or ASIC designs – memory and logic. Figure 2 shows a popular model. This is typically expanded to include logic and memory (A) as well as their defectivity metrics (D[italicsubscript]0) – lumping together random and systematic contributions, not separating them out. Such detail enables long term yield projections, but not for the implementation and quantification of DFM improvements. It mainly reveals that memory (before memory repair) dominates yield loss which is intuitive anyway.
Given these limitations, a new model is needed. In fact, current methods can actually lower yield in a design which has implemented DFM when compared to one that has not.
Yield modeling quality towards DFM benefits
The confusing array of DFM and DFY solutions implies four broad categories of yield models – random, printability, systematic, and parametric. Here, we leave parametric yield models for future publication and focus on how calibration affects the quality of DFM for the three other mechanisms.
In general, “If you can’t see it, you can’t fix it”. More precisely for DFM, “If you can’t measure the result, you don’t know if you fixed it”. For instance, wire spreading can reduce the critical area for shorts, but can introduce jogs in wires that cause printability yield loss – did you fix a problem or create one? Relating random and systematic defect contributions to SIP yield is based upon understanding process-design interactions and enables designers to make tradeoffs in yield improvement. The trade-off between different design and layout alternatives is why calibrated yield models are necessary.

Figure 3. Via failure dependence on local neighborhood
Figure 3 illustrates the relative value of yield model calibration to each of the three different types of DFM. The x-axis is categorized into ‘Low’, ‘Medium’, and ‘High’ levels of calibration and the y-axis is the normalized potential value of DFM, where 0 is no value from DFM, 1 is maximum entitlement, and a negative value indicates DFM that makes the yield worse. ‘Low Calibration’ represents a lack of sufficient test structures and data for yield modeling to enable any quantifiable yield impact when making DFM tradeoffs during the design flow. ‘High Calibration’ represents full understanding of all yield loss mechanisms and therefore enables the designer and tools to understand which DFM improvements should be performed. This understanding delivers the maximum benefit from DFM.
Random Defect DFM
This consists of well-known techniques such as via and contact doubling, wire spreading, and via borders. These were relatively new at 130nm and almost standard at 65nm. Applying them without calibration can have varied results, including a negative impact on yield and performance. For instance, performing wire spreading on copper BEOL wires can negatively impact yield if the critical area for opens is increased because the defect density for opens in copper is typically equal-to or greater than that for shorts.
For random mechanisms, the relative value of DFM rises quickly with a moderate amount of calibration. ‘Low Calibration’ can result in the sort of negative trade-off above. However, reasonable calibration goes a long way for random effects such as critical area-based yield loss and random via opens. Knowing the relative magnitudes of the defect densities and failure rates can stretch DFM all the way to 80% of entitlement. The value of ‘High Calibration’ for random mechanisms lies mostly in enabling trade-offs with systematics and printability yield loss. The infrastructure required for ‘High Calibration’ is also very powerful for improving the defect densities with short cycle time.
Printability Defect DFM
As feature sizes fall further below the wavelength of the imaging light, ways of ensuring image integrity on have progressed from simple rules-based optical proximity correction (OPC) to complex model-based reticle-enhancement techniques (RET) including model-based correction. Ideally, these techniques ensure quality features across fab manufacturing variations. Unfortunately, the interaction of process variation, RET methods, post-TO modifications, and design rules leave many patterns that cause yield loss.

Figure 4. Calibrating yield models for accurate DFM trade-offs
These ‘printability escapes’ have created a type of DFM called variously ‘OPC verification’ and ‘manufacturing sign-off’, among others. The printed features are simulated across a wide range of manufacturing variation and ‘hot spots’ – deviations from drawn – are identified and prioritized. Then, either the layout is modified or part of the process is improved to increase the fidelity of the printed pattern.
Since the lithography simulation is a physics-based model, no one would apply it without calibration. Poor calibration can cause the simulation to predict opens when shorts are the problem and the fix will be wildly incorrect. Therefore, the line for ‘Low’ and ‘Medium’ calibration is dashed for this type of DFM.
Within ‘High Calibration’, there is a wide range of realized value from DFM. The differentiating factors that cause this variation are the quality of the calibration and prediction across the process window, measurement techniques, and the ability to prioritize yield-relevant hot spots. Yield relevance is especially important when this technique is combined with random or systematic defect DFM.
Systematic Defect DFM
‘Systematic yield loss’ has been used to describe many failure mechanisms. We define it as those process-design yield models not strictly caused by printability effects. For example, line-end pull-back that causes a variation in contact failure rate would be considered a printability effect, but via fails caused by variations in local metal density would be considered a process-design systematic. Figure 4 shows two SEM images in which via failures have been localized by examining the impact of the via neighborhood. The first reveals how close via pitch, as in the case of via redundancy, may cause a systematic failure. The second reveals a failure based upon a sparse neighborhood surrounding the via.
The value curve for systematic defect DFM starts at a negative value for the same reason as the random defect curve. Done blindly, you can make costly mistakes. For example, doubled contacts increase the local contact density and thus the possibility of contact-induced metal shorts. If the contact-induced metal shorts are a dominant factor for the technology/fab, then doubled contacts can decrease yield.
The ‘Medium Calibration’ region of the curve is characterized by the ‘prioritized recommended design rules’ and similar approaches [2]. Trade-offs between different types of systematic yield loss mechanisms can be made, but the resolution is low and it is difficult to combine these with printability and random yield loss models for an overall trade-off. In this regime, systematics with gross variations from the baseline – 100’s of parts per billion (ppb) – can be called out for DFM.

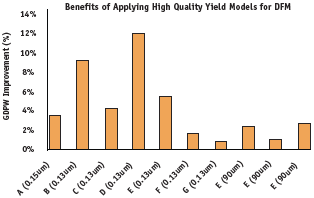
Figure 5. Proven benefit of DFM with high quality yield models
Full entitlement for systematic DFM requires that systematic yield models be calibrated to very fine granularity to capture effects that are small systematic differences in fail rate but are repeated millions of times in the product layout. Say, that active contacts have a 2 ppb fail rate while Poly contacts have a 0.5ppb fail rate. In this case, you get 4X the result from doubling active contacts than from doubling poly contacts. Since there can be more than 30m contacts on a 90nm chip, this difference can mean up to a 1.5% DFM opportunity. If the yield model is not sufficiently calibrated, the DFM tool will not know this opportunity exists and just double whatever contacts it can.
Putting It Together
All three types of DFM are needed to achieve maximum entitlement. The relative value of each depends on the technology and the fabrication facility. Some manufacturers will create design rules in which systematic yield loss is lower than in others, while others will push their defect densities down faster than competitors.
The maximum benefit from analyzing all forms of yield loss can only be achieved with the highest quality yield models throughout the design flow. In practice, different levels of calibration will be used for different types of DFM. Printability Defect DFM will typically be within the ‘high’ region, while Random Defect and Systematic Defect DFM will likely remain ‘Low’ until foundries find a way to share this information with their customers. However, there are interactions between these types of DFM and a global trade-off is required that combines all yield models, as shown in Figure 5.
Calibrating Yield Models For DFM
There are two key components to creating a high quality calibrated yield model:
- Test structures specifically designed to characterize defects for products in a technology by layer or set of layers in the process.
- Yield modeling technology that can discern the many contributions of yield loss to a particular layer, or set of layers.
Here, we focus on the second because it is the direct input required to enable the design flow for DFM.
To achieve the maximum benefit of DFM, we must calibrate the random, systematic, and printability yield models so that fine trade-offs can be made. Calibration technology is driven by the fact that the structures it uses will simultaneously include random and systematic components. As much as the product is susceptible to these yield loss mechanisms, so is the test structure designed to emulate the product and model these yield loss contributions. Any layout designed to calibrate and model only random defectivity will be corrupted by systematic yield loss. A basic yield model which does not account for these joint contributions cannot discern the trade-off of yield impact when making DFM improvement tradeoffs.
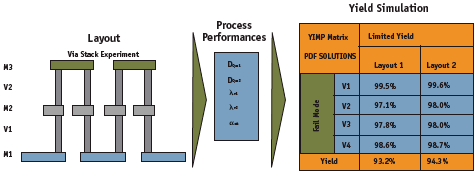
An example of the challenges of calibrating yield models to even simple test structures is shown in Figure 5. This reveals the complexity of separating the contribution of the metal island to the yield from the contributions of the separate metal and via layers. Modeling the measured yield of the structure alone does not reveal any individual contribution of a metal layer or via layer yield loss mechanism. The yield model must be combined with data from multiple sources exercising each yield loss mechanism to be able to estimate the parameters of the yield model. The total number of yield loss mechanisms is specific to each structure and based upon the fault models and process details – thus capturing the process-design interaction.
Embedded in multiple stages of the industry standard design flows, calibrated yield models enable design tools to be fully yield aware and make the appropriate tradeoffs within the standard constraints of timing, power and area.
References
- DFM Metrics for Standard Cells, Rob Aitken, ISQED 2006
- Andrzej Strojwas, 7th European Advanced Equipment Control/Advanced Process Control (AEC/APC) Conference, March 2006
PDF Solutions, Inc.
333 West San Carlos Street
Suite 700
San Jose CA 95110
USA
T: 408-280-7900
www.pdf.com


