Case study: Analyzing an electric vehicle powertrain using virtual FMEA
How the powertrain of an electric vehicle is modeled first in software, then elaborated using virtual hardware running target code, to enable virtual FMEA with rich data-gathering and analysis capabilities.
Fault modeling is increasingly important to prove the functional safety of designs used in automotive and other safety-critical applications. In a previous article [LINK To COME] we defined a ‘virtual failure mode and effects analysis’ (virtual FMEA) approach as a way of overcoming the limitations of other fault-modeling approaches.
Virtual FMEA uses virtual hardware models as its execution platform. Users define faults and the scenarios in which they occur, and then simulate them repeatedly to see what happens. Automatically generated fault reports define the impact of a fault or set of faults on a system under these scenarios.
In this case study we apply the technique to an electrical vehicle powertrain (EVP), showing how we can refine the system definition from a Software-in-the-Loop (SIL) level down to a virtual Hardware-in-the-Loop (vHIL) approach, using a Virtualizer Development Kit (VDK). Hardware faults are applied to the resulting system and its response at both the hardware and software levels is analyzed.
In the case study, the EVP is controlled by an algorithm initially modeled as C code compiled within Synopsys’ SaberRD system-modeling and simulation tool. Later, the model is refined to create a vHIL simulation that uses a VDK to model an MCU running the control algorithm. At this stage of the elaboration, the C code has been wrapped with drivers to control the MCU peripherals, and compiled for the target MCU.
SIL simulation with Saber
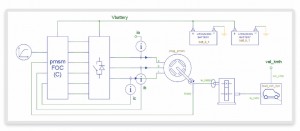
Our case study system is a simplified EVP based loosely on the Nissan Leaf, which has an electric motor, inverter, batteries, gearbox, vehicle dynamics and controller, as shown in Figure 1.
Figure 1 SIL-level EVP block diagram (Source: Synopsys)
Each of these elements is included in a system model in SaberRD.
The control system uses a vector-control algorithm that controls the ratio of in-phase and quadrature AC phase currents (‘id’ and ‘iq’, respectively) supplied to each phase of the motor. The speed proportional-integral-differential (PID) controller regulates ‘iq’ to match the velocity demand (the reference velocity). The torque demand, represented by the signal ‘i ref’, is decomposed into ‘d’ and ‘q’ components, so that the torque can be maximized using the ‘maximum torque per amp’ algorithm. Each current is regulated by a PID controller, fed by velocity and rotor-position sensors.
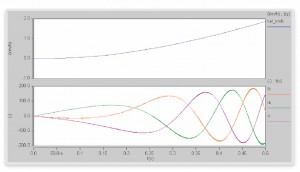
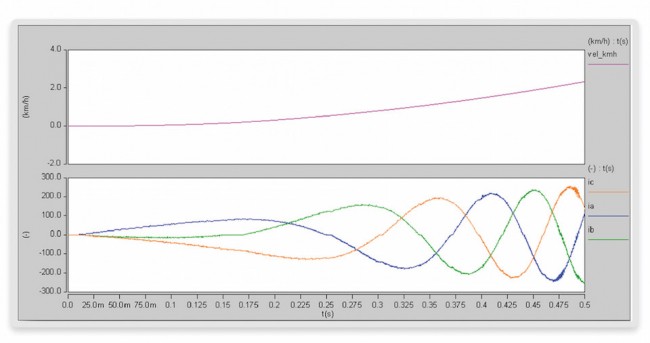
At the SIL level, the controller is implemented as a block of C code integrated into SaberRD. The controller takes as inputs the voltage ‘vbattery’, the target velocity ‘speed_ref’ and rotor-position sensor information ‘theta’, as well as the current information going to two of the motor phases ‘ib’ and ‘ic’ (‘ia’ is derived). As outputs, the controller sends switching signals for the ‘up’ and ‘down’ transistors in the inverter for each motor phase. Figure 2 shows the expected vehicle speed after 0.5s, and the three motor currents required to achieve that speed.
Figure 2 SIL-level simulation output (Source: Synopsys)
Refining the vHIL
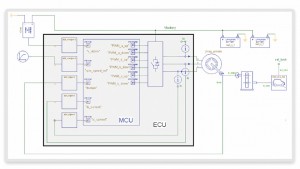
To make the simulation more representative of reality, the SIL-level model has to be replaced with target code running on the ECU hardware. To do this, the SaberRD model is changed to a system containing an ECU block, as shown in Figure 3. This ECU block contains the microcontroller running the embedded software, the inverter hardware and some blocks to condition signals representing physical values coming from the external sensors. [Other elements have been omitted for clarity.]
Figure 3 vHIL level EVP block diagram in SaberRD (Source: Synopsys)
Adapting the SaberRD model
The first step in the refinement process is to remove the controller block from the SIL-level model and replace it with an MCU block that represents the microcontroller running the control software. Since the SIL-level model was driven by ‘up’ and ‘down’ switching signals for the three phases of the inverter, these signals now have to be provided by the MCU block, using its PWM outputs. The signals are provided through Virtualizer System Interface (VSI)* co-simulation blocks, which connect to the virtual MCU model. The PWM peripherals in the virtual MCU drive the switching signals for the three phases directly to the inverter block, which outputs currents ‘ia’, ‘ib’ and ‘ic’ to drive the motor.
Inputs to the SIL-level controller included the angle signal ‘theta’ from the motor, the ‘v_dclink’ voltage reference signal, the ‘speed_ref” signal and the current signals ‘ib’ and ‘ic’ from the inverter.
The motor angle, current signals, voltage-reference and speed-reference signals will be connected at this level to an analog-digital converter (ADC) in the microcontroller, through VSI co-simulation blocks which condition the signals to a 12bit value to match the ADC’s precision. Adaptors convert bounded positive values (e.g. ‘speed_ref” or ‘v_dclink’), bounded positive and negative values (‘ib’ and ‘ic’ currents), and unbounded positive and negative values (‘theta’).
Once all these modifications are done, the last step is to configure the sample time for the VSI connector blocks, which controls the granularity of the communication and synchronization between the two simulators. The value depends mainly on the dead-time specification of the PWM signals.
VDK integration
The MCU in this example is an NXP MPC5643L, modeled in to resemble the real MCU with the same processor cores, memories, and peripherals such as ADCs and PWM controllers. All the external input and outputs pins (or Pads) that are connected to the peripherals are present at the boundary of the virtual MCU. All Pads connect to a co-simulation block as part of the VSI library.
To connect the SaberRD model to the VDK, some of those Pads have to be configured with the name of the equivalent VSI block in SaberRD. A pin-multiplexing table in the manual for the NXP MCU describes which Pads connect to each signal on the internal peripherals, such as the ADC 1 and PWM 0 controllers this case study uses.
A co-simulation link between Saber and the VDK is made by configuring the VSI property ‘cosimPath’ on the right Pad, with its name on Saber. The connection between the Pad and the internal peripheral is software configurable.
Embedded control software
The control software now runs as binary code in the virtual MCU and communicates with the system through the ADC and PWM peripherals. This demands some adaptations to the control logic.
First, the C code is compiled to run natively on the microcontroller, not through a host PC, and loaded into the Flash memory models of the virtual MCU, from where it is executed.
Control logic initialization
In Saber, the control block is configured with a sampling time that sets how often the control logic is executed – in this case every 200us. This sampling time matches the switching time of the PWM signals, and this configuration is very important for the overall system behaviour.
To achieve the same system behavior when the control software runs on the MCU, the internal clocks are configured to run at 80MHz and the internal system timer to generate an interrupt every 200us – to match the sampling time used in the Saber model.
To debug the execution of the control logic at the hardware/software interface, the trace capabilities of the VDK are used. Figure 4 shows (in a 500us window) the periodic interrupts generated by the internal system timer, as well as the functions executed for the MCU core after handling the interrupt-service routine. The figure shows the periodic execution of the ‘foc_pmsm_control_step’ function every 200us.
Figure 4 STM interrupts (top) and processor core function trace (bottom) (Source: Synopsys)
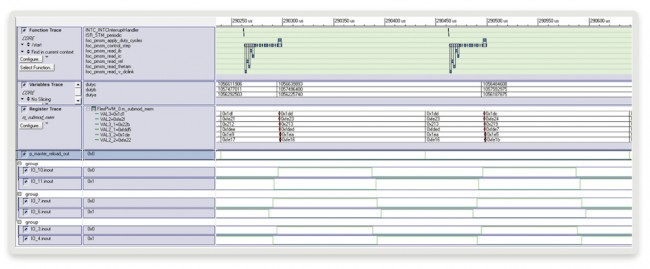
The PWM controller is also configured with a period of 200us and a dead-time of 4us, or 2 percent. This is shown by the PWM signals in Figure 5. The dead-time value sets the step size of the co-simulation between the VDK and SaberRD tools.
Figure 5 PWM related traces (function, variables, registers, internal reload signal and outputs) (Source: Synopsys)
Control logic step
Every time an interrupt is triggered the function ‘foc_pmsm_control_step’ is executed, using the previous and current values of the input signals. This information is then used to program the PWM to calculate duty cycles to apply to the inverter to make the motor match the reference speed.
The input signals are read through the ADC, but converted back from their 12bit digital representation to a physical value – the opposite transformation to the one that happened in the signal-conditioning blocks on the SaberRD side.
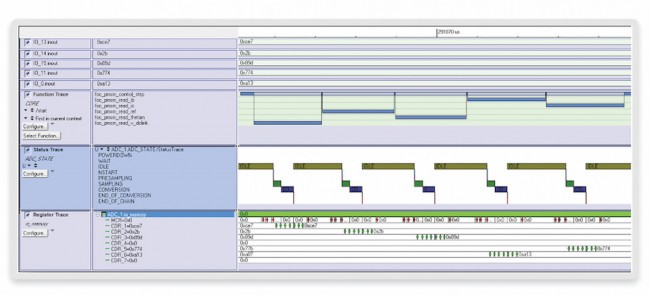
Similar information can be obtained by using the hardware/software tracing capabilities of the VDK. Figure 6 shows, at the top, the group of input values coming from the signal-conditioning blocks in SaberRD. The graph below displays the functions part of the ‘foc_pmsm_control_step’ main control routine that reads and adapts the input values (e.g. ‘foc_pmsm_read_ic’). Below these two graphs, traces of the ADC are shown.
Figure 6 Hardware/software traces showing the reading of sampled values by the ADC (Source: Synopsys)
Once the new input values have been read, the new set of duty cycles are calculated and applied to the PWM peripheral, which sends them to its outputs at the beginning of a new duty-cycle. An internal hardware signal indicates exactly when the values are applied, and the VDK can trace and correlate how these signals are changing with the software execution and the external PWM signals applied to the inverter block in SaberRD.
Figure 7 shows, from the SaberRD point of view, the results when simulating at the vHIL level (compare with the results from the SIL-based approach used in Figure 2).
Figure 7 Resulting speed (top) and motor currents (bottom) after half a second (Source: Synopsys)
Fault injection scenarios
Having set up the models, the next step is to inject a hardware fault and analyze whether the software will detect and correct it. Using SaberRD we define a permanent fault to be injected into the system – in this case, leaving the ‘dclink’ sensor signal ‘open’ after simulating for 0.4s. (see Figure 8). We also create an experiment to execute the fault, in a transient simulation that lasts 0.75s (see Figure 9).
Figure 8 Creating the ‘dc_link_open’ fault in SaberRD (Source: Synopsys
Figure 9 Creating the fault experiment in SaberRD (Source: Synopsys)
The fault scenario sets the sensor signal that is sampled by the ADC to open, while a voltage is still applied to the inverter – risking the chance of 400V and 300A destroying the hardware if the fault is not detected and correctly managed.
Diagnostic software
In today’s safety-critical systems, most faults are detected and handled by diagnostic software that detects faulty behaviur and triggers alarm and recovery mechanisms.
Diagnostics can form up to 40% of a piece of embedded software, and validating it can absorb up to 25% of overall test costs. Testing it is challenging because the diagnostic code usually only runs when very special, and difficult to reproduce, conditions occur.
In a fault where dclink is left open, the software should detect it by checking the sensor value. If the data is out of bounds, the software should then put the system into a safe state (e.g. by disabling the PWM outputs) within a certain time.
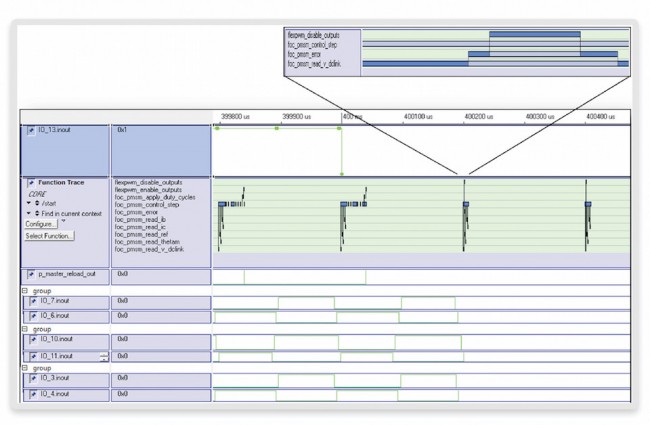
To validate the code, the fault experiment is simulated in the vHIL model. The fault is injected on the SaberRD side and the response traced through the VDK, as shown. In Figure 10, at precisely 400ms the ‘v_dclink’ input signal goes to zero. The function trace shows that the fault is not immediately detected, since it occurs just after the ‘foc_pmsm_ read_v_dclink’ function (the worst-case scenario), and takes around 200us to be recognized. The software then calls an error handler to shut down the outputs of the PWM. The figure also shows that the ‘p_master_reload_out’ signal, and the complementary PWM signals for the three phases, stop toggling.
Figure 10 Hardware/software response to the ‘v_dclink’ open fault (Source: Synopsys)
Figure 11 shows the system level response in SaberRD. The current signals are progressing as before until around 0.4s, when the fault is injected and the currents fall smoothly to near zero as the PWM signals are disabled.
Figure 11 ‘ia’, ‘ib’ and ‘ic’ values for the fault experiment (Source: Synopsys)
Conclusions
The case study demonstrates the advantages of this vHIL-based approach to virtual FMEA. The first is that systems can be described in abstract software terms first, and then elaborated into forms that are more representative of the real hardware using VDKs. The second is that once you have this virtual hardware, you can inject faults into it repeatedly in an automated and deterministic way for example to check that a new version of your target software has not introduced new errors.
Further information
*For more on VSI, see page 4 of this PDF
FMEA in automotive software development using virtual prototyping, physical modeling and simulation
Author
Victor Reyes is technical marketing manager, virtual prototyping group, Synopsys. Kurt Mueller is business development and CAE manager, Asia-Pacific region, Saber, Synopsys.
