DRC+: a pattern-based approach to physical verification
DRC+ is a new methodology that algorithmically characterizes design variation through pattern classification. A traditional design rule is used to identify all design structures that share a common configuration. Then, the 2D geometric situations (pattern variations) around the configuration are extracted and classified. Since all such classes share a common configuration, each situation class represents design variations of the basic configuration. Typically, over 70% of the situation classes are either unique or appear only twice in a design. This shows that their design impact is low, and that it is possible to enforce a manufacturing-friendly DFM constraint for these situations. DRC+ uses statistics derived from measurements of the situation classes as an alternative to simple critical dimension (CD) or edge placement error (EPE) thresholds used in classic printability verification. By identifying which situation classes have bad printability statistics, we can algorithmically find DRC+ rules.
Introduction to DRC+
Design rule constraints (DRC) are the industry workhorse to ensure both the physical and electrical manufacturability of VLSI circuits. However, as devices continue to shrink from generation to generation, and more aggressive resolution enhancement techniques are implemented, the geometric rules needed to ensure manufacturability have increased in complexity and are getting more difficult to define. In fact, it is often possible to find 2D layout patterns that are DRC-clean (i.e., they meet all defined rules) but still exhibit lithographic printability issues on wafer at the extremes of manufacturing process tolerances.
DRC+ is a new checking methodology that is effective in identifying these problematic 2D patterns, yet efficient enough to allow checking at early stages of the physical design flow (e.g., during custom layout and automated routing) as well as at the final sign-off stage. Like traditional DRC, each DRC+ rule enforces a constraint on design geometry, and when the constraint is violated, an error marker is generated with the constraint value, indicating how to fix the error. Unlike DRC, each DRC+ rule also has an associated 2D pattern that acts as a filter to localize where the constraint is applied.
DRC+ uses fast pattern-matching capabilities in tools such as Calibre to identify these patterns in a layout. This enables the DRC tool running a DRC+ rule deck to enforce tighter design constraints only where specific problematic patterns occur. Figure 1 shows a DRC+ rule that enforces a tighter ‘min_space + 20nm’ line-end space constraint where the U-shaped pattern is found.
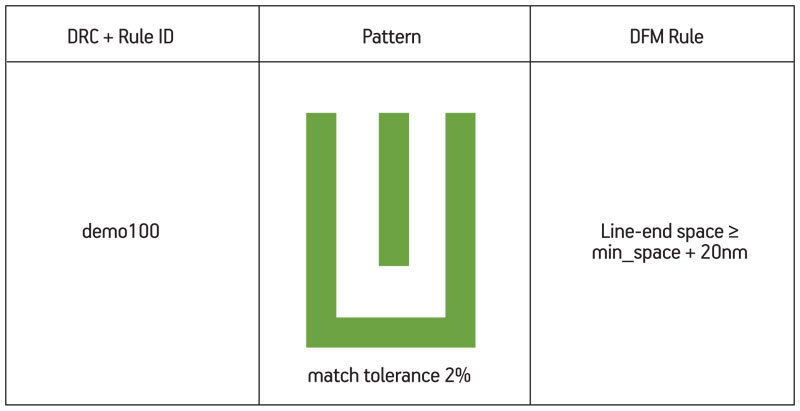
Figure 1
An example of a DRC+ rule
Source: GlobalFoundries
DRC+ operates strictly on design geometries without any intrinsic understanding of the underlying manufacturing technology process. Therefore, the effectiveness of DRC+ depends heavily on the quality of the rule deck. From a classic design-for-manufacturability (DFM) perspective, a good DRC+ rule deck should have the following characteristics:
- Identify all 2D patterns that pass DRC, but exhibit manufacturability issues. This guarantees that designs that pass both DRC and DRC+ can be manufactured with high yield.
- Minimize impact on design area by only enforcing tighter constraints when necessary. This allows the technology to be fast and efficient.
- Validate by printability verification (PV) simulation and wafer data.
The following sections describe in more detail how DRC+ works, and how DRC+ rules are created to ensure accurate and efficient verification.
How DRC+ works
To understand how DRC+ works in practice, consider Figure 2. It shows how DRC+ can be used to apply constraints to tip-to-side configurations in a layout.
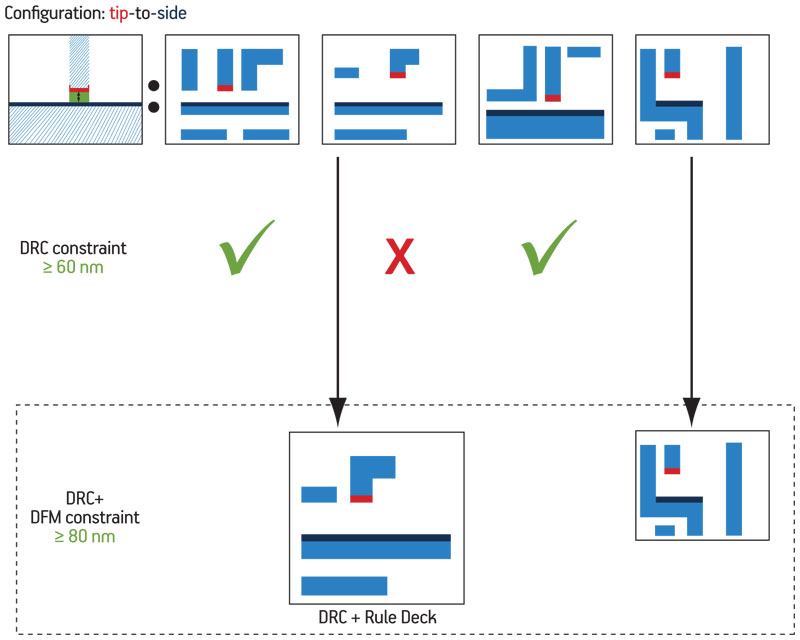
Figure 2
A DRC+ rule addresses a particular configuration (e.g., tip-to-side distance) and includes both a layout pattern and a DFM constraint
Source: GlobalFoundries
Each DRC+ rule includes a specific tip-to-side pattern, and a preferred rule, that is, a rule with a more stringent constraint to be applied in that pattern situation. The figure shows several tip-to-side patterns that vary due to the surrounding context. The standard DRC rule specifies a constraint of >= 60nm, while the DRC+ rule deck adds a more stringent constraint (>= 80nm) when any of several patterns is detected.
In this example, patterns one and three are not considered problem patterns and are not included in the DRC+ deck. The standard constraint is applied and they pass DRC checking. The second pattern matches a DRC+ rule and fails because it does not meet the 80nm constraint, while the last pattern passes since it has sufficient spacing.
In the following sections, we will describe how DRC+ patterns and preferred constraints are determined through a printability analysis of typical designs.
A new approach to DRC
One way to create DRC+ rules is to identify hotspots using printability verification simulation, and then craft a DRC+ rule to disallow the problematic pattern in design. Although this procedure seems straightforward, many problems arise in following it. First and foremost, there is no easy way to convert a hotspot into a pattern. Consider the hotspot shown in Figure 3(a) (p. 46).
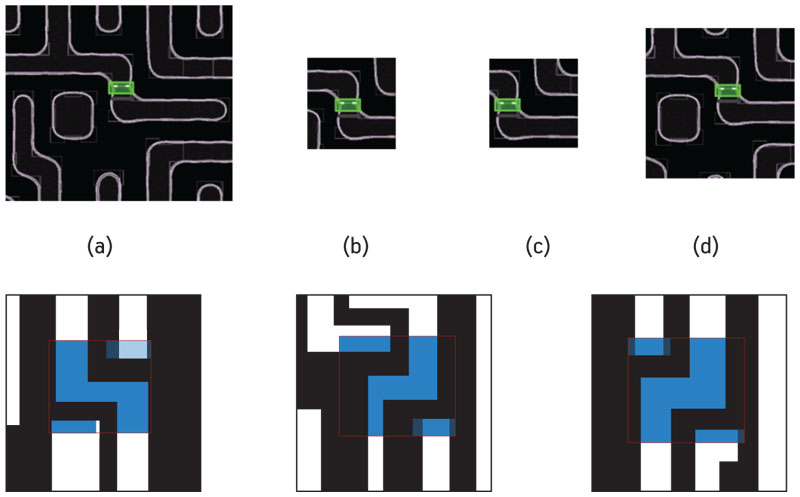
Figure 3
Potential DRC+ patterns resulting from (a) hotspot, (b) a small pattern, (c) an off-center pattern, and (d) a large pattern
Source: GlobalFoundries
The hotspot marker flags a location where the simulated minimum width of the contour at a process corner is less than a manufacturability threshold value. A marker, however, is not a pattern. To construct a pattern, the geometries surrounding the marker must be taken into consideration. Figure 3(b-d) are just three examples of many patterns that might be extracted around the marker: a small clip, an off-centered clip, and a large clip. Corresponding potential DRC+ patterns are shown underneath the hotspots.
Figure 3
Potential DRC+ patterns resulting from (a) hotspot, (b) a small pattern, (c) an off-center pattern, and (d) a large pattern
Source: GlobalFoundries
In practice, the manual process of examining hotspots one-by-one is arduous, and it results in the creation of relatively few DRC+ rules. Standard practice is to adopt a best-effort approach of ranking hotspots by severity and addressing them starting from the most severe hotspot. Remaining hotspots are simply waived.
The DRC+ methodology employs a different, algorithmic approach to creating rules. Rather than using a hotspot as a starting point, we start from the perspective of design, design style, and design variability to establish at the outset which patterns should be considered for DRC+ rules. These patterns, by construction, cover the entire design space of a sample layout. Also by construction, they can be directly translated into a DRC+ rule. Consequently, there is no optimization necessary to determine what the pattern should be.
Finally, each pattern is evaluated as a whole for its printability everywhere in the sample design. If the printability is good, we encourage the use of that pattern in design. If the printability is bad, the pattern can be ruled out through DRC+. In all cases, the design impact and manufacturability is quantified for every design pattern, rather than every point on a simulation contour. The result of DRC+ analysis is hot patterns rather than hotspots. This provides effective screening while enabling much higher efficiency and throughput than a litho simulation for an entire chip.
Situation classification
The DRC+ process starts by identifying pattern configurations (e.g., a tip-to-side configuration) along with variations, called situation classes, due to different surrounding shapes. In the DRC+ methodology, situation classes are determined by extracting patterns from representative designs. A pattern diameter of approximately four times the minimum pitch of Metal Layer 1 is used to perform the extraction. Situations are then classified using a pattern classification EDA tool with an edge tolerance of 5nm. The purpose of the edge tolerance is to prevent minor design variations from creating extraneous situation classes.
To further analyze the situation classes, we bin the situations classes by the number of situations contained in that class. If a situation class appears only once in a design, it falls into the ‘unique’ bin. If the situation class appears two times in a design, it falls into the ‘2’ bin. In addition to ‘unique’ and ‘2’ the other bins are ‘3-to-10’, ’11-to-50’, ’51-to-100’ and ‘over 100’. The resulting histogram is shown in Figure 4.
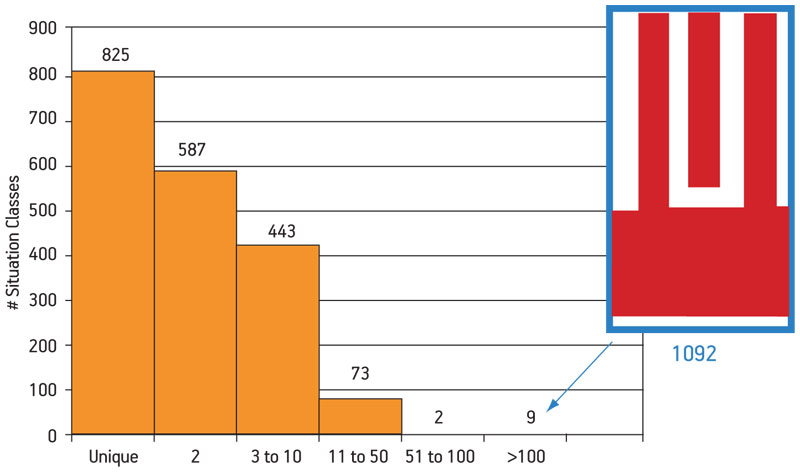
Figure 4
Class histogram for the tip-to-side pattern configuration
Source: GlobalFoundries
The histogram plot shows that of the 1936 situation classes, 825 (42%) are unique and 587 (30%) appear only twice. This quantifies the large amount of design variability in this sample layout and illustrates why it is difficult to create a comprehensive set of DRC and DRC+ rules. There are a few situation classes that are used with very high frequency. The highest frequency situation appears 1092 times in this sample layout. This pattern should be carefully considered in evaluating printability, due to its high design impact.
Determining printability
The next step uses printability analysis to determine which situation classes have below-average printability. These become patterns for DRC+ rules. The required constraint to ensure printability for a given situation or pattern (here, the tip-to-side distance) becomes the DRC+ preferred rule.
A special metric called design-induced edge printing variability (DIEPV) is used to evaluate the printability of each situation class [1]. DEIPV essentially represents printing error over the process window for a given situation—the greater the magnitude of DIEPV, the greater the error. Since we are interested in the variation in printability of the same configuration over different situations, we need to develop configuration DIEPV statistics for all the extracted patterns.
To analyze DIEPV per situation class, we compute the mean DIEPV for each situation class and then bin classes by those means. In Figure 5, we plot the number of situation classes that fall into each mean DIEPV bin, creating a histogram. The bins on the right are the easiest to manufacture, while the hardest to manufacture are on the left. In the next section, we examine a few situation classes on a case-by-case basis.
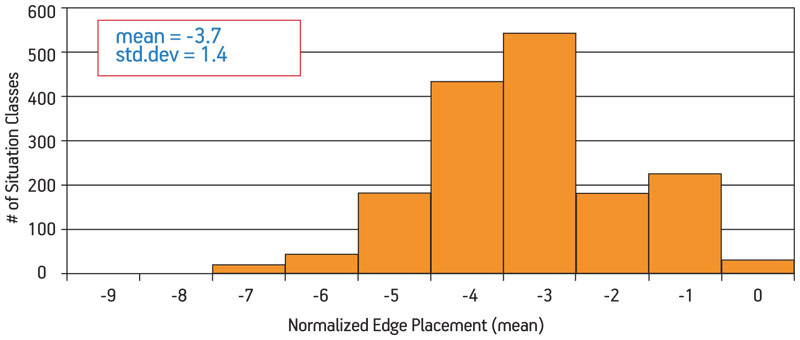
Figure 5
Histogram of mean DIEPV over situation classes. The overall edge DIEPV statistics are also shown as a point of reference.
Source: GlobalFoundries
Creating DRC+ rules
Using the data in Figure 5, we can implement a simple threshold algorithm to select DRC+ rules from the situation classes by comparing the DIEPV statistics of each situation class to the values of the overall layout [1]. For this data set, the threshold value is set to -3.9 using this technique. The DRC+ rule implied by the situation class is straightforward: the pattern is the situation class itself, and the preferred DRC rule is the normal configuration rule (i.e., the minimum tip-to-side distance) constrained at a predetermined ‘DFM’ value with more manufacturing margin than the minimum DRC.
Figure 5
Histogram of mean DIEPV over situation classes. The overall edge DIEPV statistics are also shown as a point of reference.
Source: GlobalFoundries
Applying this algorithm, Figure 6 (p. 48) shows three examples of patterns with a situation class DIEPV of less than -3.9. These patterns are added to the DRC+ rule deck. In each case, the patterns are highly irregular 2D structures. In addition, for each rule we have, as part of the analysis, the frequency of occurrence as a measure of design impact, and a mean DIEPV that quantifies the manufacturing benefit of excluding this pattern.
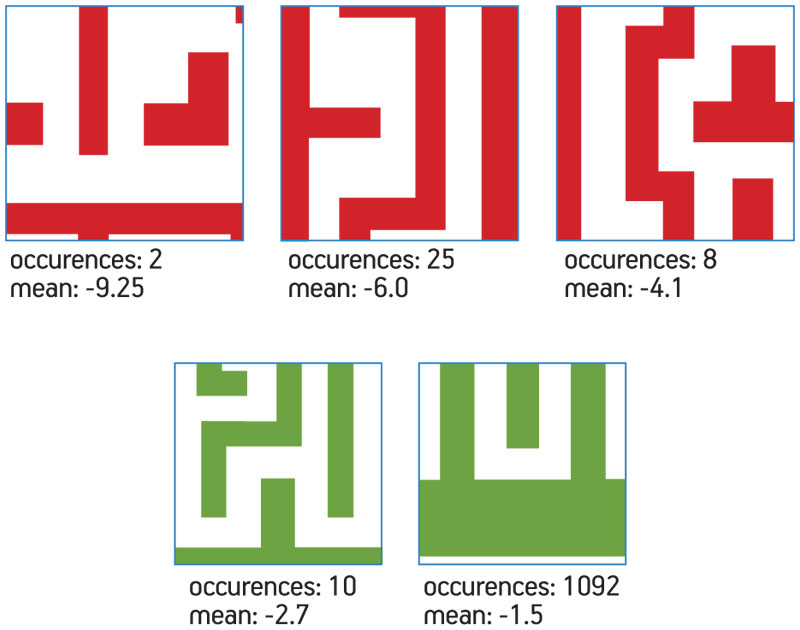
Figure 6
Situation classes with DIEPV less than -3.9 (red) are ruled out with DRC+, while situation classes with DIEPV greater than -3.9 (green) are “good” patterns that designers are encouraged to use.
Source: GlobalFoundries
The green patterns show two examples of ‘good’ situation classes with DIEPV greater than -3.9—in other words, not all 2D structures are problematic. In addition, the most frequent pattern with 1,092 occurrences has a very good DIEPV of -1.5. The fact that this construct has both high design impact and good manufacturability is evidence of good manufacturing-design co-optimization.
Tool implementation
From an implementation standpoint, we have worked with EDA vendors to implement DRC+ by employing both their traditional DRC capabilities, as well as new pattern matching features available in the latest generation of tools. For example, Calibre from Mentor Graphics provides a familiar interface showing error markers, the DRC+ rule in question, and the configuration within its context (i.e., its situation). The equation-based DRC capability of Calibre also provides specific hints on how to fix the violation. Where the physical verification platform is integrated into the physical design environment, most repairs can be done automatically by the physical design tool, such as the router [2].
One of the key advantages of the DRC+ methodology is that it can apply advanced DFM rules to avoid printability problems without the overhead associated with full lithographic simulation. An example of typical runtimes is shown at the bottom of Figure 7 (p. 48). The runtime of DRC+ on Design A clearly demonstrates the speed advantage of using a pattern matching engine for full chip DFM physical verification.
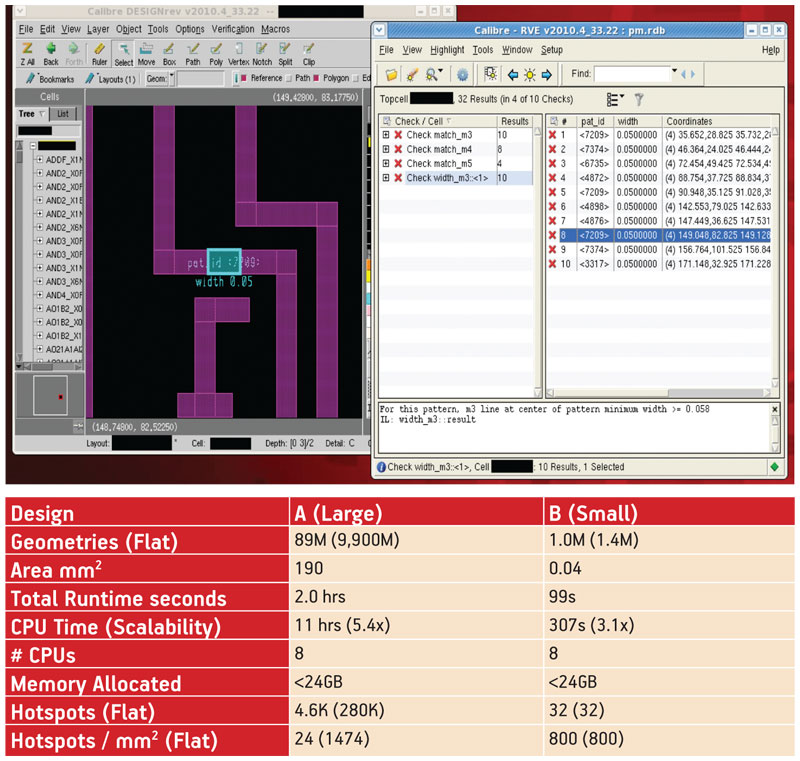
Figure 7
DRC+ implementation in the Calibre environment and typical runtimes
Source: GlobalFoundries
Conclusion
Tools that provide fast pattern matching capabilities make implementation of DRC+ straightforward [3]. For the user, it is mainly a matter of updating the standard DRC rule deck with the expanded DRC+ pattern-based rule deck provided by GlobalFoundries. Performance is on a par with traditional DRC runs.
With the creation of thousands of DRC+ rules comes the need to update the rules. In particular, the situation classes, class statistics, and number of occurrences are all dependent on the sample design as well as manufacturability process. Design evolves over time from test chip to product, and the manufacturing process also matures. GlobalFoundries systematically tracks these changes through a pattern database to ensure the most up-to-date DRC+ deck for our customers.
References
[1] “Developing DRC+ Rules through 2D Pattern Extraction and Clustering Techniques,” Vito Dai, Luigi Capodieci, Jie Yang, and Norma Rodriguez, Advanced Micro Devices.
[2] “Calibre InRoute – Signoff DRC Analysis and Automated Repair,” Mentor Graphics, http://bit.ly/kQbFme.
[3] “Calibre Pattern Matching: Picture It, Match It…Done!,” Mentor Graphics, http://bit.ly/j3TvYX.
GlobalFoundries
Corporate Headquarters
840 N. McCarthy Blvd.
Milpitas, CA 95035
USA
W:www.globalfoundries.com
T: +1 408 462 3900