Wally Rhines separates the signal from the noise
 Dr Walden Rhines is Chairman and CEO of Mentor - A Siemens Business
 A cynic will say there are only two types of forecast: wrong and lucky. That isn’t true, the sports-to-politics statistician Nate Silver has an uncanny ability to call events. He has written one of the best explanations as to why forecasts go astray, The Signal and The Noise – if you are a forecasting or math buff, it’s worth your time.
But Silver has not applied his skills to silicon. Someone who has is Wally Rhines, chairman and CEO of Mentor Graphics. Rhines has a reputation in the business for ‘doing the math’ and doing it well. He is sharing his latest observations in a series of global keynotes.
Rhines’ latest observations come in two parts.
First, he has dug into the reasons why semiconductor growth and revenue forecasts so often miss the mark. Last year analysts’ expectations for 2016 coalesced around 3.5% growth. “But one year later, and two-thirds of the way through 2016, the numbers are down by 0.8%. That’s a big swing,” he notes. Rhines has some solid ideas for what needs rethinking.
Second, Rhines is proposing a way of detecting future sources of growth – particularly in the Internet of Things – that could better indicate both where the market is going overall and what specific segments most justify R&D investment.
To do that, he has applied a well-known technique from fields as different as cancer rate forecasts and software project management: The Gompertz Distribution.
Silicon’s ‘hidden’ sales
Wally Rhines argues that a major challenge when forecasting semiconductor growth is that you must account for two types of recession: the macroeconomic and the silicon-specific when supply shoots past demand. It does not help forecasters that the two types do not occur simultaneously. “These variables don’t change together,” noted Rhines.
He starts his analysis by highlighting some stable market data.
- IC unit demand has been growing predictably for more than 30 years.
- Overall silicon area measured in wafers has a 27-year CAGR of 6.9%
- Revenue per wafer square inch has generally stayed flat at $32.70 since 1994.
Apply those metrics to 2016’s market and, funnily enough, you will get a forecast of around 3.5% growth, said Rhines, very close to the original predictions. Why the swing to -0.8%?
“What the analysts don’t fully account for are the cellphones where companies design their own applications processors,” said Rhines. Yes, IC production and wafer shipments are tracked, including unit volume for in-house processors, but the unit value is not – it is hidden in the cellphone.
In-house silicon has been progressively taking up more of the market (Figure 1). Already, Samsung (Exynos), Apple (A9) and Huawei (Kirin) have their own devices. Xiaomi (Rifle), LG (NUCLUN2) and ZTE (Fast Dragon) have new ones on the way. “[The Apple and Samsung share] is $10bn of IC revenue, about 3.0% of the market. That is the shortfall analysts don’t count,” said Rhines.
Factor that into the forecast and you get a figure that takes revenue back to around 3.5% growth.
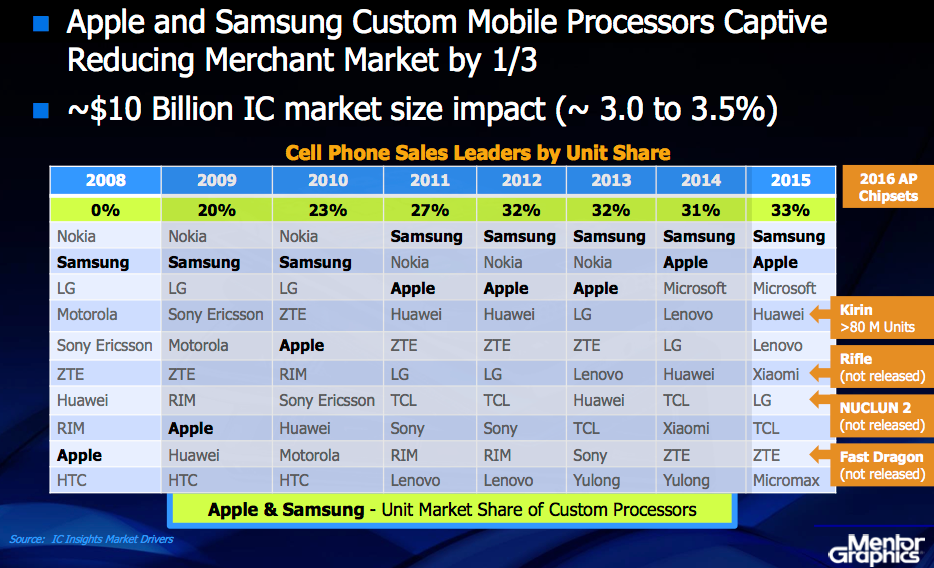
Figure 1. Effect of captive semiconductor revenue reporting (Mentor Graphics/IC Insights)
This does not only have implications for determining global semiconductor revenues. If the trend continues, the merchant market obviously needs to seek out opportunities elsewhere. But how do they make that call?
The S-curve – not just a matter of life and death
Actuary Benjamin Gompertz published his distribution in 1825, applying it, as his profession suggests, to demographic modeling.
In its cumulative distribution based on a double exponential, it begins to carve out an S-curve for units against time. It assumes fastest growth at the start of a process or market, slowest at the end (Figure 2). Basic inputs are determined from historically validated bell-curves of shipments/events-per-period for the subject’s typical lifecycle.
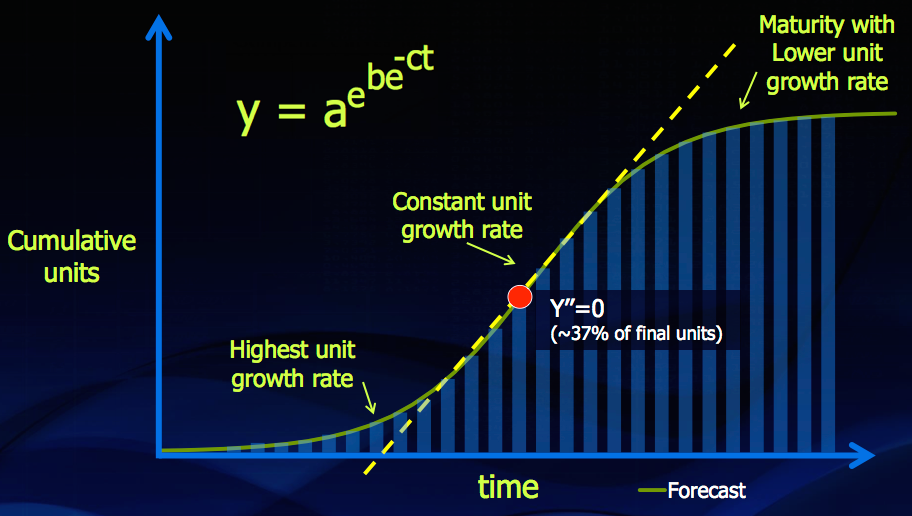
Figure 2. Gompertz curve lifecycle (Mentor Graphics)
Wally Rhines personally encountered its use on a software project for IBM. Based on a linear analysis, it appeared the project was going to be finished ahead of schedule. But then the lines of code written per man-day began to fall. Time to warn the client? Actually IBM expected the slow-down. An initial Gompertz-based forecast led it to do so.
Can this method highlight growth and maturity in semiconductor sales? Rhines showed that many earlier semiconductor sales drivers have followed a series of such S-curves (Figure 3).
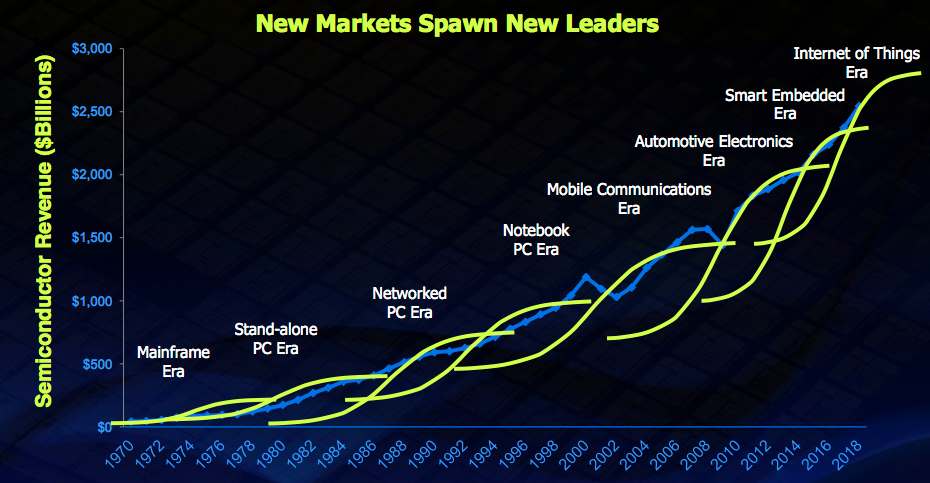
Figure 3. New applications drive S-curve waves of growth (Mentor Graphics/VLSI Research)
Among these, the longer term data available from two mature sectors, desktop PC shipments (Figure 4) and cellphone subscriptions (Figure 5), support a Gompertz forecasting strategy.
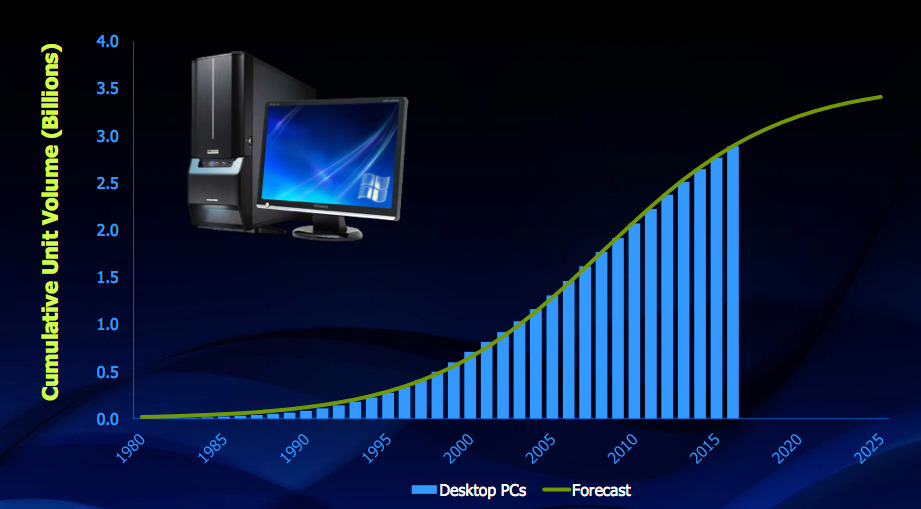
Figure 4. PC desktop shipments S-curve (Semico Research, IC Insights, Mentor Graphics)
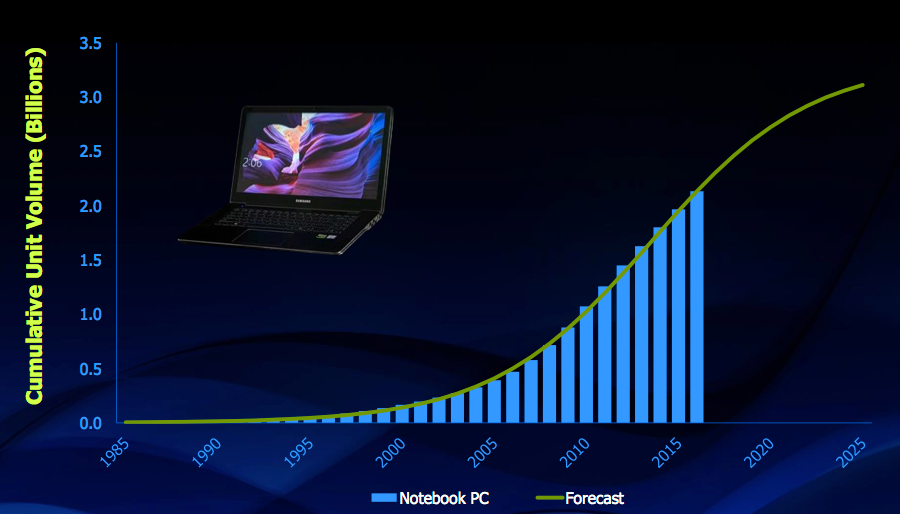
Figure 5. PC notebook shipments S-curve (Semico Research, IC Insights, Mentor Graphics)
Time then to apply Gompertz’s model to today’s buzz market, the Internet of Things.
The Gompertz call on the IoT
Wally Rhines broke down an analysis of IoT revenue opportunies into the market’s three most commonly recognized segments:
- Data centers as data processors
- Gateways as data collection hubs
- IoT nodes as edge data generators
Data centers
It is tempting to think of servers as a mature market, dominated by the likes of Google and Amazon. But the IoT will generate massive amounts of new data. Moreover, many companies looking to exploit it are new to the world of exascale computing.
For example, Rhines cited aviation’s increasing use of in-flight diagnostics. A passenger jet can generate 10Tbyte of data for every 30 minutes of flight. In that context, he said that we are reaching a point where, for engine manufacturers, the services they can envisage based on that information “are now becoming more valuable than the engine itself”.
The Gompertz curve for servers (Figure 6) backs up the likelihood of ongoing and increasing demand – it is not yet at half way – and there are new technologies poised to stimulate sales.
Today, there is 40 Gigabit Ethernet and widespread deployment of optical technology. But, Rhines noted, we also need to consider the emerging 100 Gigabit Ethernet standard and a shift from hard-disk drive to solid-state storage servers likely to take hold by 2018.
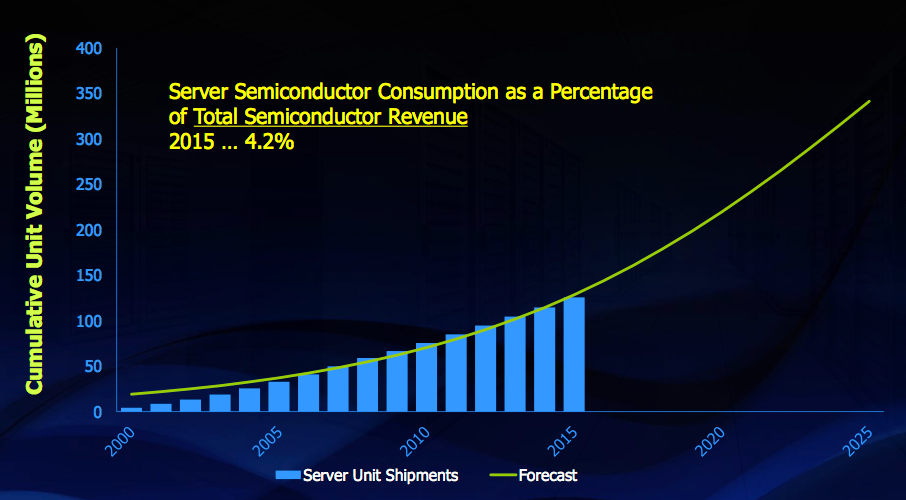
Figure 6. Servers S-curve (Gartner Group, IC Insights, Mentor Graphics)
Gateways
Gateways form an important part of the IoT. Two reasons for that are:
- The need for smaller, lightweight edge devices deployable in vast quantities, feeding larger gateways.
- The requirement for some ‘local’ gateway processing enabling rapid response times and alleviating data traffic volume on backbone networks.
Rhines said this represents a major semiconductor opportunity – “these gateways have a lot of chips” – particularly for medium-level VLSI integration and memory.
The gateways segment is in its infancy, but based on current volumes shows tremendous promise (Figure 7).
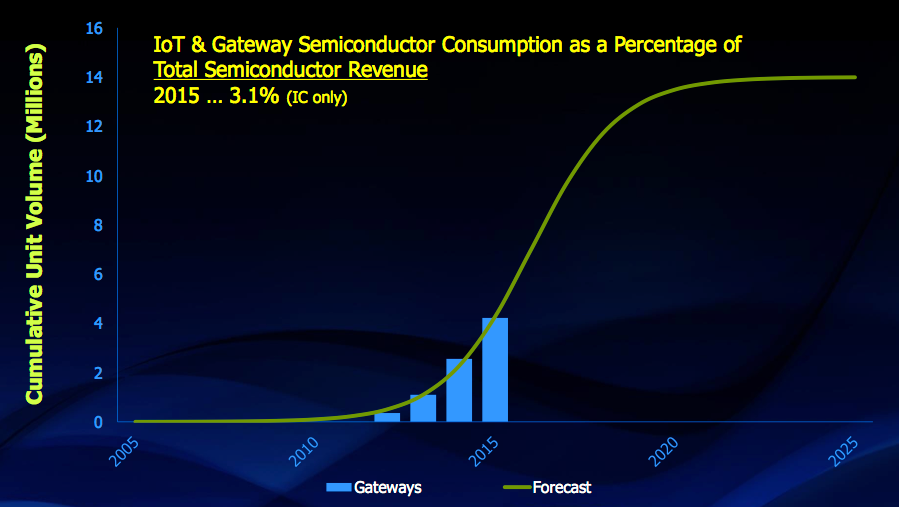
Figure 7. Gateways S-curve (IC Insights, IC Market Drivers)
Edge IoT devices
The edge segment is more diffuse.
From a design point of view, Rhines noted that it requires combinations of sensor, actuator, imager and transmitter in small form-factors. There is a potentially broad range of prices, but often favoring the lower-end.
“Many chip companies are struggling with the need to integrate at a multi-physics level,” Rhines says, “and then the ability to run a system simulation.” That however is not stopping a great many looking at how to do all that.
The use-cases for IoT devices are also many and varied. The revenue data today points to the highest volumes in urban infrastructure, Rhines said (Figure 8).
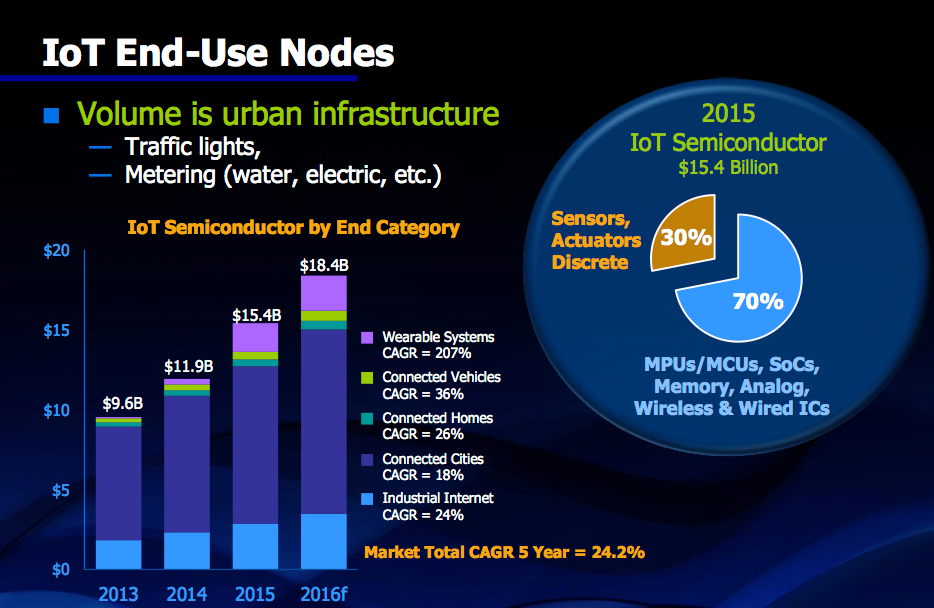
Figure 8. IoT market revenues (IC Insights, IC Market Drivers)
In this context, smart meters (Figure 9) are exhibiting a strong Gompertz-based opportunity based on a history of already rapidly accumulating volumes.
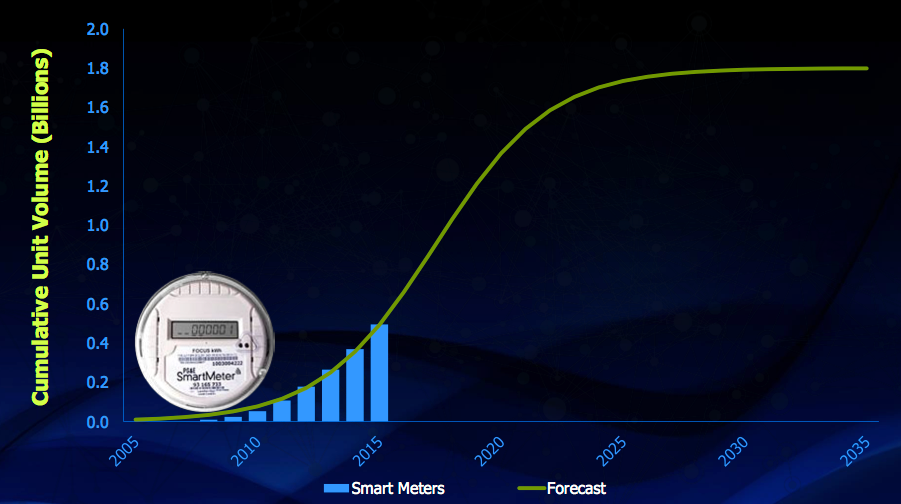
Figure 9. Smart meters S-curve (IC Insights, IC Market Drivers)
However, the market for wearable devices is by comparison nascent. Nevetheless, if it follows the pattern, it could rocket within the next five years (Figure 10).
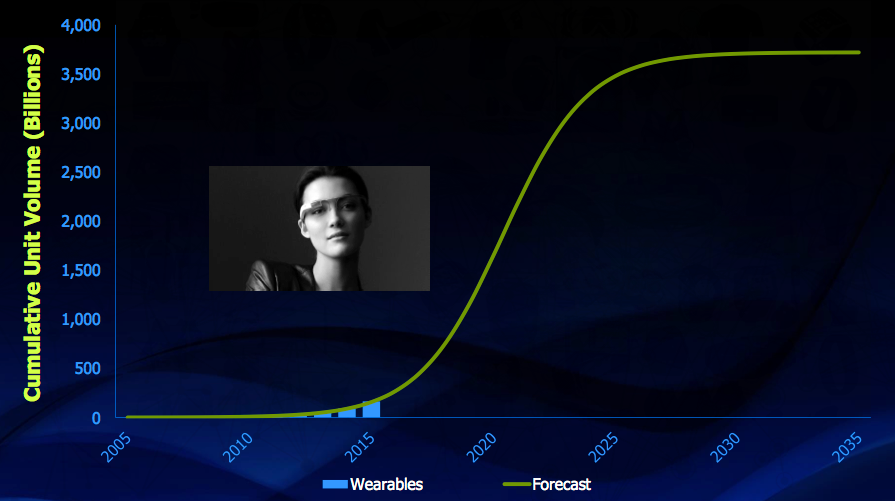
Figure 10. IoT wearables S-curve (IC Insights, IC Market Drivers)
For now, Wally Rhines said an analysis could suggest that the edge market is still “relatively disappointing” at only $15B (or 4-5% of semiconductor revenue). “But these nodes will become more complex with more communications, more pre-processing and more sensors as well as increased A-to-D, RF and multi-physics,” he added.
Where’s the money?
Wally Rhines was blunt that the greatest revenues from the IoT will go to data owners. Information is power. But it is not all doom, gloom and commoditization. A Gompertz analysis suggests the silicon volumes are there. It is all about how you build on them.
Semiconductor companies should attempt to “capture data ownership value”, Rhines said. Greater integration of silicon sensors will lead to new applications that could provide some way for them to do that.
Integration on that multi-physics level will also bring in new players, fueling innovation and design, and thereby a new wave of semiconductor growth.
Overall though, the key may lie in how well chip companies can integrate themselves within the revenue flow of not just an Internet of Things but an ‘Internet of Services’.
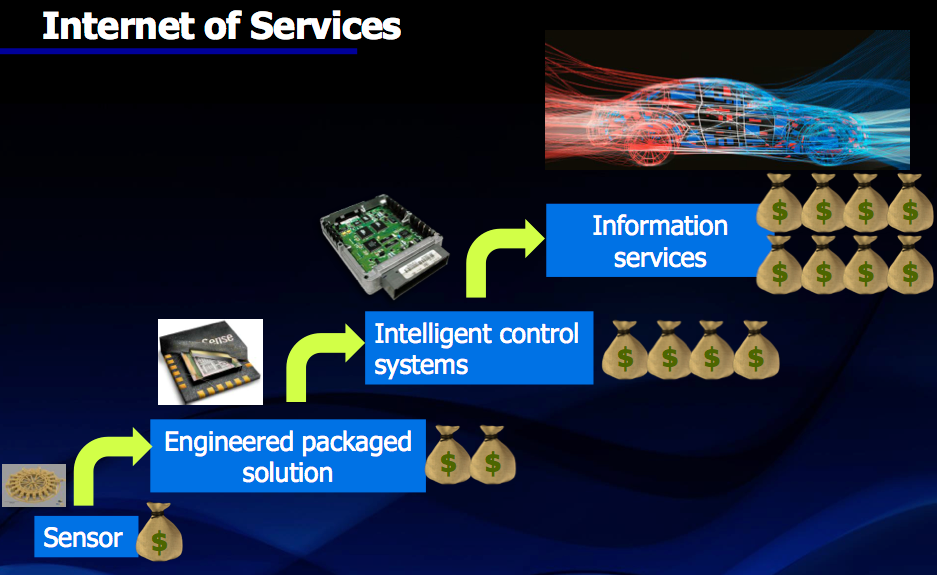
Figure 11. From IoT to IoS (Mentor Graphics)
