Tightening the loop on coverage closure
The article describes how methodologies such as graph-based intelligent testbench automation will help engineers efficiently create verification scenarios and stimuli. This is a powerful way of enhancing advanced verification environments and reducing common verification headaches (e.g., reaching coverage goals).
Such strategies can help to free up resources, in terms of time, people and hardware, so that the design team can focus on the challenges of realizing a more ambitious verification plan and of creating better functional coverage metrics. This enables the verification team to ensure that the device has been exercised in a far more comprehensive manner, thereby reducing the resulting defect density.
The article considers some broadly applicable approaches with specific reference to Mentor Graphics’ inFact tool. This has new algorithms to improve coverage and has been optimized for the use of multi-machine simulation farms to linearly improve simulation runtimes.
The complexity of electronic designs and their verification environments has moved the industry from a predominantly directed test methodology (where the team’s coverage goals are typically limited by available resources) to automated techniques (such as constrained random simulation). Because of the significant increase this has brought to the number of tests that need to be applied, two new verification challenges have emerged. These are the definition of adequate coverage measurements and the setup of efficient automated testbenches.
Reaching closure on these coverage goals often depends on complex feedback between the coverage metrics and the directives placed on the applied stimulus. The feedback loop steers the essentially random generation process toward areas of low coverage, providing dynamic course correction. Unfortunately, implementing this feedback loop is often a manual process, requiring analysis of the metrics and an understanding of the generation characteristics of the testbench. The way in which constraints are solved by different verification tools also influences the quality of results. Closing the coverage loop more efficiently is now a critical R&D point for tools and methodologies.
Source: Mentor Graphics
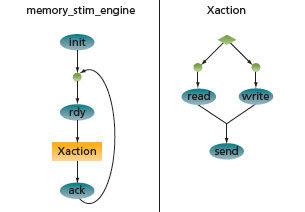
FIGURE 1 Simple rule graph showing hierarchy and loop
A new class of verification tools in the intelligent testbench automation (ITA) category overcomes some of the obstacles to achieving coverage closure. A sub-category within ITA is known as rule- or graph-based tools. These allow you to build testbench components whose activity is controlled by one or more rule graphs that define, in a very compact way, the verification scenarios and stimuli to be applied to the device under verification (DUV) or to one of its interfaces. At simulation runtime, these rule graphs interact with the tool’s algorithms (and possibly other testbench components) to efficiently achieve functional coverage goals. These rule-based intelligent testbench automation tools monitor the stimulus or input coverage by keeping track of which scenarios have been applied. In their most effective deployment, this tracking function and the tool’s intelligent algorithms are used to avoid redundancy by not repeating scenarios unless the user specifically instructs them to do so.
The rule graphs are defined by describing all the legal sequences of activity within each verification scenario, with every step in the sequence corresponding to an action. In turn, each action is linked to code in the form of a task or function in high-level verification language (HVL) code. The description syntax is an extended BNF style and, therefore, provides a very comprehensive representation in relatively few lines of code. These include sequential operations, parallel choices and, for some tools, other higher-level constructs such as loops. A hierarchy in the rules enables complex scenarios to be described in a modular fashion. Figure 1 depicts a simple rule graph.
Source: Amulet Technologies
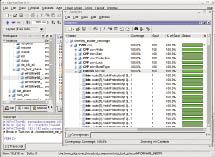
FIGURE 2 Coverage at 100% hitting each cross product only once
The inFact tool from Mentor Graphics explicitly defines the set of scenarios to be covered in graph form. Using graph theory, intelligent algorithms replace randomly generated stimuli to achieve verification goals that would otherwise require significant manual coding and, perhaps, many iterations to reach the desired outcome. These intelligent algorithms include the weighting of certain choices to deal with significant imbalances in the number of unique cases in different test scenarios and the feedback loop required to continually adjust the nature of purely random generation. Typically, the redundancy in random generation can require 20-30 times more tests than would be necessary using intelligent algorithms—and the inefficiency in random generation increases exponentially as the complexity and scope increases. The cross coverage results across a number of variables (as seen in Figure 2) show the contribution of intelligent algorithms toward achieving coverage.
The success of random stimulus generation is measured by using the HVL’s coverage measurement capabilities in the form of coverpoints, covergroups and their cross coverage. The current way in which coverage measurement is addressed takes its lead from the random nature of the automation process in the testbench. This is because there is very little direct control in the selection of stimuli, especially when it comes to complex combinations of parameters and the sequences in which operations are performed. Coverage metrics have to record the nature of the stimuli applied so the information can be used in any subsequent course corrections.
Source: Mentor Graphics
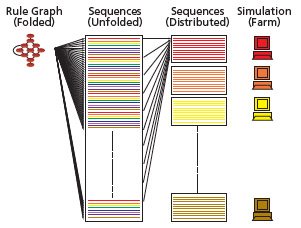
FIGURE 3 Distribution across multiple mystems
A rule-based graph more explicitly defines a verification plan, with parameter values and other choices specified in the context of the scenarios. The algorithms solve the challenges of balancing stimulus needs across test types and minimizing or eliminating redundancy, so that the stimuli applied are more predictable. Their systematic nature means that they obey the defined goals at runtime. So, if the goal is to create each scenario at least once, then the ITA tool will generate each scenario defined by the graph exactly once, in an apparent random order. The chore of tracking the stimulus applied and steering it to reach the required goal in terms of input stimulus is, therefore, taken on by the testbench automation tool, giving engineers more time to focus on metrics for functional versus input coverage.
The most difficult tests to create are those for which there is no way to directly cause the behavior of interest from the inputs to the system. This scenario is not unusual in a complex SoC. Such situations are generally coded as assertions, with cover points defined to track their occurrence. The use of an abstract rule graph to describe the circumstances under which these situations might occur (given the obvious efficiency in generating those scenarios without repetition) provides a powerful way to explore the behavior of your design under different operating conditions. In addition, if the intelligent testbench automation tool includes a scenario distribution capability, multiple simulation jobs can be used to linearly decrease the required time to run all the required scenarios, since a server can be used to assign each job a completely unique subset. The inFact tool includes the first technology that enables verification teams to easily use multi-machine simulation farms to linearly improve simulation runtimes.
How the stimulus is applied
Source: Mentor Graphics
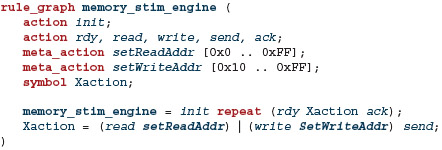
FIGURE 4 Rules including meta_actions
As recommended in advanced verification methodologies such as the Open Verification Methodology (OVM), the scenarios and stimuli are created by a high-level component that sends transaction-based information either to a transaction-level DUV or, via a driver or transactor, to a pin-level DUV. The driver or transactor translates the transaction-level data structure that contains the stimulus information (e.g., a bus transaction or data packet) into the appropriate pin-level signal changes. This includes handling any handshaking or bus-protocol aspects, such as dealing with arbitration or splitting the packet or transaction into separate bursts or sub-packets.
The ITA tool should support many verification styles and languages and generate templates for the component being created, into which the HVL code can be inserted. The number and type of TLM ports that need to be instantiated are determined by the testbench’s architecture, the number of DUT interfaces to be driven, or the number of TLM ports associated with those interfaces. Thus, any testbench component can easily replace any existing stimulus generator by giving the new component the same ports as the original. Any communication between the verification component and other elements in the testbench also follows standard mechanisms.
The OVM provides a framework that includes both a methodology and code libraries that a verification engineer can use to build a testbench that is modular, interoperable and reusable. It includes mechanisms for creating the various components and objects required for a complete testbench as well as for communicating information between these components. The OVM also uses HVL constructs to define stimulus generation at the scenario level, to collect functional coverage measurements, and to create scoreboards to determine pass/fail criteria. Because of the unique modular architecture of the OVM, ITA tools can be conveniently integrated into the methodology’s testbenches.
The basic unit of communication in an OVM-style testbench is some form of transaction data structure that may be passed from component to component, either by copying it and ‘putting’ it onto a TLM channel via the appropriate port, or by ‘putting’ a reference (a pointer) to it. In a similar manner as that employed in a constrained-random methodology, the testbench stimulus generation component will first build the data structure by making choices for the transaction parameters and then send the transaction through the port (i.e., ‘put’) onto the channel for consumption by another component.
Source: Mentor Graphics
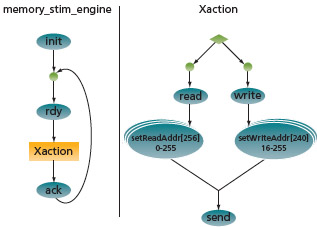
FIGURE 5 Rule graph showing meta_action choices
In inFact’s implementation of the graph-based ITA methodology, this is done by using combinations of the previously mentioned actions with special actions, called meta-actions. The actions map to atomic testbench activity, which in this context could be a choice between a read or a write transaction with the associated code setting the read or write attribute of the data structure. Meta-actions allow the definition of a range of integers, with the range being context-specific according to where it is defined in the possible sequences (or paths) through the graph. If, for example, the possible addresses for a read are different from those for which a write is valid, meta-actions, such as setReadAddr and setWriteAddr, can be created with the appropriate ranges. The tasks associated with these meta-actions will then get a value from this range passed into them by the intelligent algorithms, and the address attribute of the transaction data structure can be assigned this value. Once the data structure is constructed, the transaction is sent by a subsequent action, called send in this example shown in Figure 4.
As the graph is traversed, each combination of choices, whether between different operations, such as a read or a write, or within a defined numerical range, constitutes a different scenario, or path through the graph (Figure 5). This means that, from a coverage perspective, each cross product of any number of variables will be generated once and only once within each context that they are used, unless the user directs the tool to do otherwise. On real projects, this has resulted in multi-week verification runs being reduced to just a few hours, often with the achieved coverage increasing from a plateau in the 70-80% range up to 100% of the defined goal.
Using a methodology such as graph-based intelligent testbench automation to efficiently create verification scenarios and stimuli is a powerful way to enhance advanced verification environments to reduce common verification headaches. It can help to free up resources, in terms of time, people and hardware, to focus on the challenges of realizing a more ambitious verification plan and of creating better functional coverage metrics. This enables the verification team to ensure that the device has been exercised in a far more comprehensive manner, thereby reducing the resulting defect density.
Mentor Graphics
Corporate Office
8005 SW Boeckman Rd
Wilsonville
OR 97070
USA
T: +1 800 547 3000
