OCP performance monitoring with programmable instruments
The process of proving the system is working and performing optimally, under all application and environmental conditions, has become too inefficient and difficult for existing methodologies.
Traditional methods for addressing post-silicon requirements have reached the point of diminishing returns. What was once an exercise of designing, implementing and verifying 25,000 to 50,000 gates of instrumentation and writing a few hundred or thousand lines of programming and analysis software has expanded to comprise designing, implementing and verifying more than 200,000 gates of instrumentation, and perhaps ten thousand or more lines of code.
This article describes the automated insertion of programmable instruments as enabled by the capabilities of the Open Core Protocol. It allows much of the design and implementation burden to be lifted off the hardware design team. With a little upfront planning, a powerful on-chip instrumentation scheme can be realized with far less effort.
The Open Core Protocol (OCP) offers many benefits, including the simplified integration and implementation of multicore designs. Its unified interconnection scheme allows designers to create complex systems composed of third-party and legacy intellectual property (IP). As with most complex and heterogeneous systems, the ability to visualize and analyze performance characteristics is key to both understanding and verifying system behavior, and then to fine-tuning the system for optimal power and performance.
Visualization and performance analysis capabilities are necessary during initial modeling, verification and then, after tapeout, observation of the device running in the target system. Having such capabilities on-chip requires embedded instrumentation IP, preferably in a lightweight, easily inserted and dynamically programmable scheme. These characteristics allow embedded instruments to be used for a variety of functions including performance monitoring, assertions, functional analysis and debug—even fault insertion and transaction stimulus.
The increasing skill shown by software and systems engineers in leveraging such embedded IP is overcoming initial reluctance towards ‘surrendering’ silicon real estate. They have shown that this approach can streamline the complex test and validation process.
A few additional requirements must be considered:
- Configurability: Given the configurability of OCP, the embedded on-chip instruments must also be configurable.
- Flexibility: An SoC will be composed of a variety of busses, interfaces and IP blocks. Therefore, any approach must not be limited to OCP circuits.
- Ease of insertion: Such a configurable and flexible system requires automated insertion.
The IP must comply with the OCP Debug Specification. However, even in the absence of compliant IP cores or switch fabrics, practical performance monitoring can be implemented today.
Instruments, insertion and applications
This trifecta is a combination of 1) programmable instruments, 2) automated insertion tools and 3) instrument programming and analysis applications. It is an embedded-instrumentation package that delivers comprehensive performance monitoring and analysis.
Source: DAFCA

FIGURE 1 Dynamic multi-level views
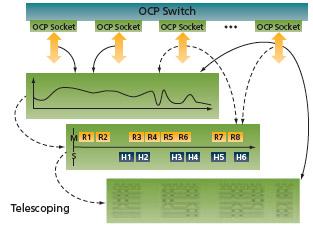
The objective is to provide the user with a spectrum of visualization and analysis methods. It ranges from coarse views on many interfaces (e.g., aggregate system throughput or worst-case latency) to increasingly granular, targeted and highly specific views at the socket level (e.g., discrete read/write transactions). The approach is consistent with most conventional analysis, diagnostic and debug techniques. It seamlessly marries broad views of system behavior with ‘telescoping’ views that are informed by the discoveries at each level of the visualization and analysis process (Figure 1).
The package is configurable, flexible and lightweight. Our primary interest is the OCP interconnect, but these instruments can be applied to almost any bus or interface in a design. They are user-configured and inserted into the RTL design automatically.
Perhaps the most important element is the programming and analysis application. This provides a graphical interface and high-level commands (through a Tcl interface) to program and operate the on-chip instrumentation infrastructure. All command/control and data extraction is done through a standard IEEE 1149.1 (JTAG) interface.
The basic suite of OCP performance monitoring functions includes the measurement of aggregate throughput per interface, master/slave throughput, instantaneous or average request/response latency, instantaneous or average event latency and worst-case latency.
Basic instrument configuration
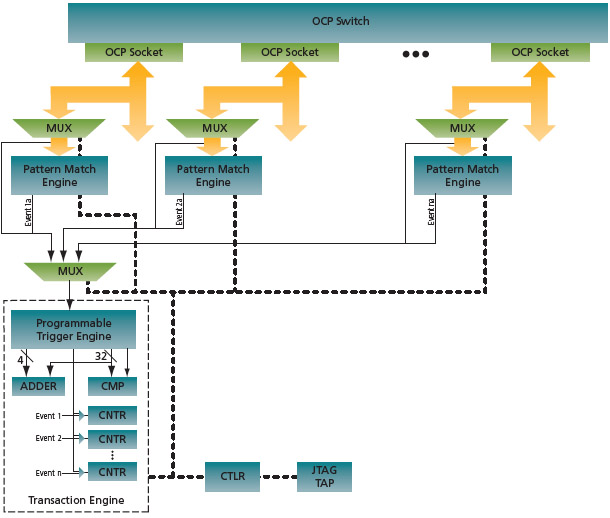
Performance monitoring functions can be realized with a distributed instrumentation scheme. Three forms of instruments are used: signal multiplexors, pattern match engines and transaction engines. Each is user-configurable (e.g., bus width, states, GPIO). All are in-system programmable and run at-speed without disrupting the normal operation of the system.
The configuration shown in Figure 2 is an optimal balance of functionality and low area overhead. Each multiplexor and pattern match engine operates autonomously, so multiple interfaces can be monitored concurrently.
Source: DAFCA

FIGURE 2 Performance monitoring instrumentation
The multiplexors are used to reduce the number of signals presented to the pattern match and transaction engines. At runtime the user specifies which signals to monitor, through the programming and analysis application.
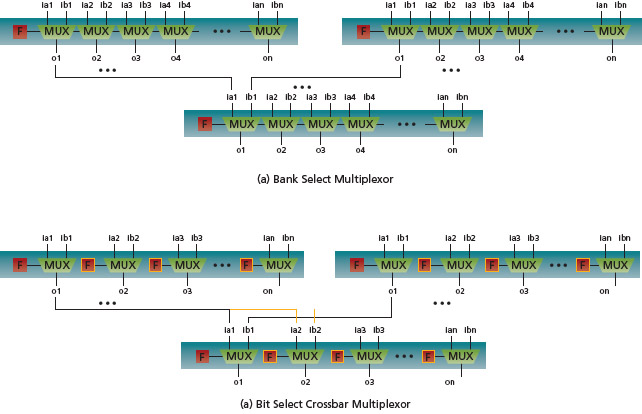
The multiplexors can have various forms depending on the application, flexibility and area overhead requirements. The bank select multiplexor is the smallest and least flexible (Figure 3a). In this configuration, signal-bank-a or signal-bank-b is selected through a serially programming register. The bit select crossbar multiplexor (Figure 3b) offers additional flexibility by providing a serial programming register for each 2:1 multiplexor, and additional signal fan-out between multiplexor stages. This gives the user the most flexibility to select a combination of signals. In practice, the bank select multiplexor can be used in most performance monitoring configurations. Other configurations may be appropriate if a variety of validation and debug functions are to be supported with the same instruments.
Source: DAFCA

FIGURE 3 Multiplexors
The basic pattern match engine can detect user-specified patterns on each OCP interface. Whenever one is detected, the event signal is asserted. The pattern values, mask values and state machine configuration are specified at runtime within the programming and analysis application. The event signals are transferred through another set of multiplexors to the transaction engine.
The transaction engine provides functions that include a programmable state machine, comparators, counters, timers and adders. It can be programmed to count events, measure intervals between events, and measure the frequency of events. All such actions can be started and stopped conditionally. Conditional actions can be based on event sequences, throughput values, counter values, latency values, or sideband events detected on OCP signals mapped down to the transaction engine through both multiplexor stages. Even signals from other parts of the SoC can be used on the multiplexor inputs. The transaction engine may also be programmed with user-defined embedded memory for optional signal tracing functions. All measurement values and calculated results can be retrieved by the programming and analysis application for display and additional analysis.
Source: DAFCA
FIGURE 4 Pattern match engine
On-chip and off-chip analysis
Given the bandwidth limitations of the IEEE JTAG 1149.1 interface, large amounts of real-time data cannot be streamed off-chip. While a high-speed trace port such as the Nexus interface [1], can be used in some cases, many designs cannot accommodate one. In the baseline configuration shown here, we have assumed a system without a high-speed trace port. This highlights a primary advantage of programmable instrumentation: the ability to perform on-chip analysis and reduce the serial data transfer volume.
Nevertheless, there are situations that require off-chip analysis. This is especially true when on-chip data can be transferred into a variety of visualization and analysis tools. For example, the on-chip data can be retrieved and formatted into an OCP trace file and fed into a tool such as Duolog’s OCPTracker. Even if a subset of OCP trace file fields is populated, transfer sequences and performance metrics (e.g., throughput, latency) can be analyzed.
Here again, the programmable nature of the instruments is beneficial. When it comes to extracting on-chip data, there is a trade-off between temporal and spatial visibility. The amount of trace data to be captured is limited by the width and depth of the embedded trace memory. The user needs to make such trade-offs and maximize the use of the embedded memory. For example, if the user wants to see all activity on multiple OCP interfaces, more transfer cycles can be captured if the ‘MData’ field is omitted. Likewise, the user may choose to reduce the number of transfer cycles captured by creating a capture filter based on a combination of ‘MAddr’ and ‘MCmd’, or filter using signals associated with tag or thread extensions. Each technique is accommodated by a simple expansion or reduction of the observation scope; the designer has ultimate control over the trade-off between temporal and spatial visibility. The programmable nature of the instruments allows these decisions to be made at runtime.
Notes
[1] The Nexus interface is defined as part of the OCP Debug Specification (http://www.ocpip.org/socket/whitepapers/OCPIP_Debug_Working_Group_Whitepaper_3_26_2007.pdf)


