How LTTng enables complex multicore system development
The Linux Trace Tookit next generation provides open source tracer technology that helps surmount debug and optimization challenges
The Linux Trace Toolkit next generation (LTTng) tracer comes extremely close to addressing the issues that arise from increasing multicore system complexity during debug and performance optimization.
Software developers have to cope with highly complex multicore architectures. They challenge any engineer’s ability to understand and track the interactions between multiple applications and the operating system. Extending investigation to anything beyond the simpler logic faults and crashes has become nearly impossible using traditional techniques. ‘Stop-and-stare’ debug and other techniques that rely on breakpoints fall short of what is needed. Developers are turning to tracing technologies to overcome these limitations.
Modern tracers can generate application and system centric trace data at higher levels of abstraction. They also provide a software context for the trace events. Such benefits have helped tracing become a more yielding approach for the application developer.
A tracer, such as LTTng, ideally does not have to stop all or even parts of the system. It is therefore very useful in real-time and complex systems that consist of several CPUs with interacting programs and processes. The trace data can be analyzed to identify bottlenecks, inefficiencies, errors, and other issues.
A tracer must handle large amounts of data, be portable, systematic, and fit easily into the development process. It should also interact with a trace analyzer tool and scale with system size. Here, we review how far LTTng goes toward meeting these criteria.
LTTng
LTTng is a software-based tracer for use on target hardware. It is being developed by the open source software community with industry and academic sponsorship. Its most recent generation, LTTng 2.x, features a unified architecture for kernel and user space tracing, shown in Figure 1.
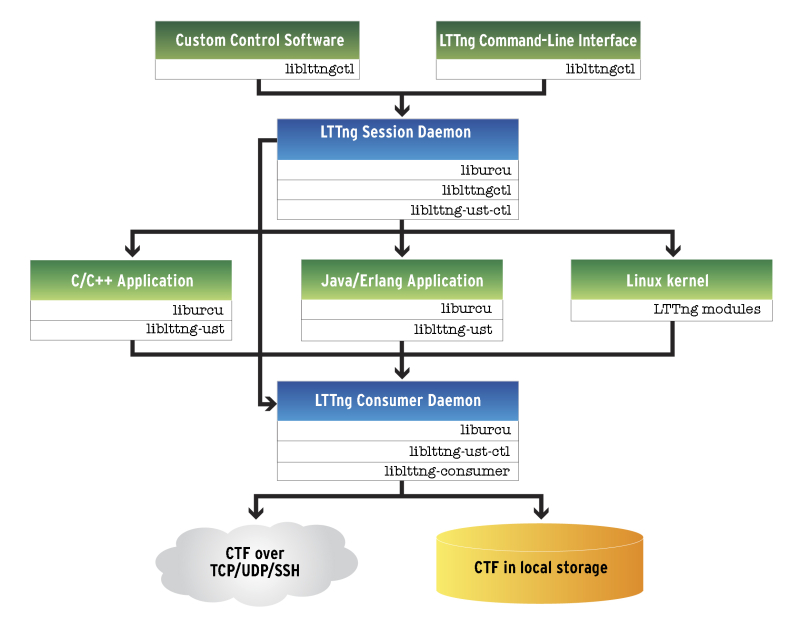
Figure 1
The LTTng 2.x architecture released in March, 2012 (Source: LTTng Project – click image to enlarge)
Unified tracing makes it easy to compare what is going on in the kernel with what is going on in the application at the specific time when an important event occurs. Even if the application is traced, kernel trace information can complement user space data as the kernel has some knowledge of those user space activities. The kernel trace effectively provides a second opinion.
Implementing instrumentation
Instrumentation is comprised principally of two elements. First, the conceptual design of a set of trace event types that are abstract entities. Second, the declaration of tracepoint types that correspond to those types in the code. A trace event type has a useful name and often a set of named and typed payload fields. These fields can contain data unique to each individual trace event.
There is a one-to-one relationship between trace event types and tracepoint types. A tracepoint type can be instantiated more than once, and each such tracepoint can produce any number of trace events in any order, where the trace events are instances of the trace event type.
To instrument an application using LTTng, the software architect must create and add a tracepoint provider to his source projects. This is done by adding a simple header and C file.
Individual tracepoints in the code that refer to the trace event types defined in the tracepoint provider header file must also be added.
All of this is performed by using C pre-processor macros included from the lttng/tracepoint.h header file (details are described in the man pages of lttng-ust). Inclusion of the tracepoint provider header file also creates a constructor in the C file which registers the tracepoints with LTTng at runtime.
Inside LTTng LTTng was designed for efficient use wherever the addition of too much overhead would impact the system behavior (e.g., with regard to tight real-time timing constraints). Features LTTng employs to achieve this include:
- The trace clock: This clock is a highly architecture-dependent part of any software tracer, because the time bases of different computer architectures are different. A lock-less clock can use LTTng in a non-maskable interrupt service routine.
- Static tracepoints: These are fast because they are compiled into the source code. There is no trap instruction or system call, as is often the case with dynamic tracepoints. The overhead of an inactive static tracepoint is essentially negligible and similar to the execution of a NOP instruction.
- Declared and typed trace-event fields: The benefits of using typed trace-event fields are quality and safety, but there is also a performance advantage. Metadata that describes the fields can be produced before tracing starts, so it does not need to be recalculated and re-added at trace time.
- Per-CPU buffering and lock-free writing: The circular buffers used in LTTng allow for insertion without locking. This is very important for scalability: The larger the system, the greater the risk of contention. To make lock-free writing possible, LTTng uses one set of buffers per CPU for kernel tracing and one buffer per CPU per process for user-space tracing.
- Zero-copy writing and read-copy updating: Reading the data and writing it to file (either on local storage or over a network connection) is performed by the consumer daemon. This combines the data from kernel and user space trace buffers into a smaller number of files without requiring an intermediate buffer. The read-copy update scheme allows a read transaction to take place without requiring the write transaction to finish, and this minimizes cache-line missing and replication.
- Common Trace Format: The Common Trace Format (CTF) is a binary file format suitable for transferring and storing trace data. The compactness of the format helps tracer performance. In addition, a well-defined and open file format makes interaction between different trace tools easier as it sets a de facto standard for trace data interchange.
- Trace data analysis: Trace event data is usually not available in an abstracted form that allows for straightforward interpretation by the user. To attain a higher abstraction level from the raw data, analyses need to be applied which can extract stateful representations of this data. The analyses available in a tool such as the Mentor Embedded Sourcery Analyzer include data abstractions that range from simple filter algorithms to state machine like constructs. Examples are shown in Figure 2.
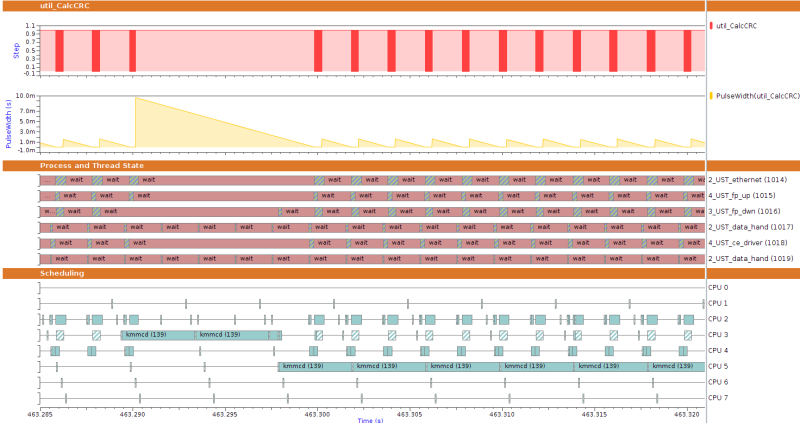
Figure 2
Sourcery Analyzer data visualizations based on analyses abstracting specific aspects from raw trace event data (Source: Mentor Graphics – click image to enlarge)
Another important aspect of trace data analysis is the correlation in time of events from different sources and/or domains. It is hard to assess the distance in time between timestamps for trace events represented as classic textual logs. But a graphical display of these events on a linear timeline is very useful for orientation. Time is represented linearly in such a graph so that clustered events do not block the view. Multiple graphs with different classes of events can be produced. Sourcery Analyzer offers visualization utilities that enable the user to output trace event analyses results to a variety of expedient graph types. An example, showing kernel and user space events, is depicted in Figure 3.
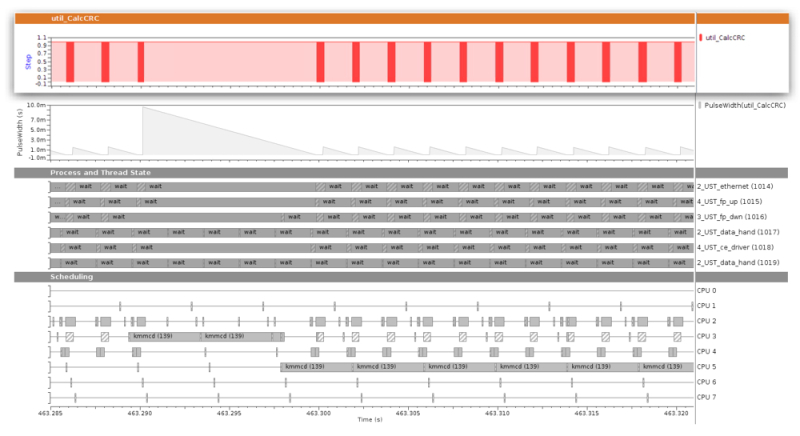
Figure 3
Sourcery Analyzer displaying kernel- and user-space data graphically. The top of the graph (red vertical bars) has been created directly from the custom user-space trace data, showing for each trace event of a particular trace event type, the value on one of its payload fields (Source: Mentor Graphics – click image to enlarge)
As an important feature of a sophisticated trace data analysis tool, the state of the traced system can be largely reproduced or re-modeled by analyzing data from the trace events. Whereas the meaning of custom trace events is unknown to a trace data analysis tool, kernel state and function flows can be re-modeled in built-in analyses. An example of stateful analysis of kernel traces in Sourcery Analyzer is shown in Figure 4.
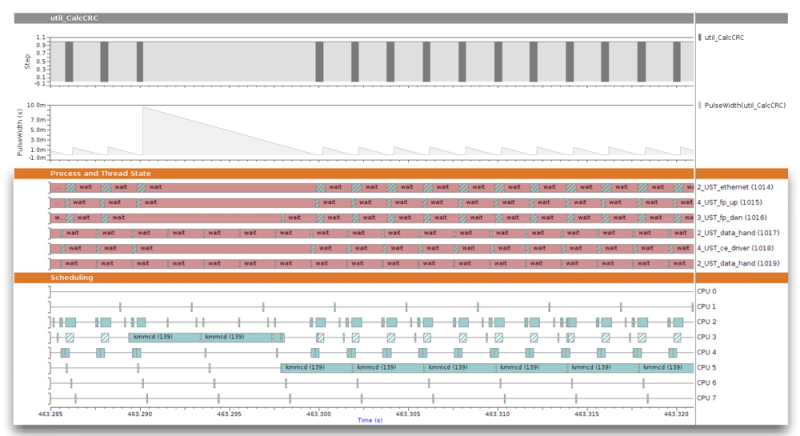
Figure 4
Stateful analysis of kernel traces. As a result of the PID vs. CPU analysis, each point in time shows which process, if any, ran on which CPU. The six thread-state graphs above show in which state each thread has been over time (Source: Mentor Graphics – click image to enlarge)
Another important feature of a trace data analysis tool is its ability to produce deduced graphs. These graphs extract some aspect of another graph, such as a mathematical function or a measurement, which can be placed on the same timeline. An example of this is shown in figure 5.
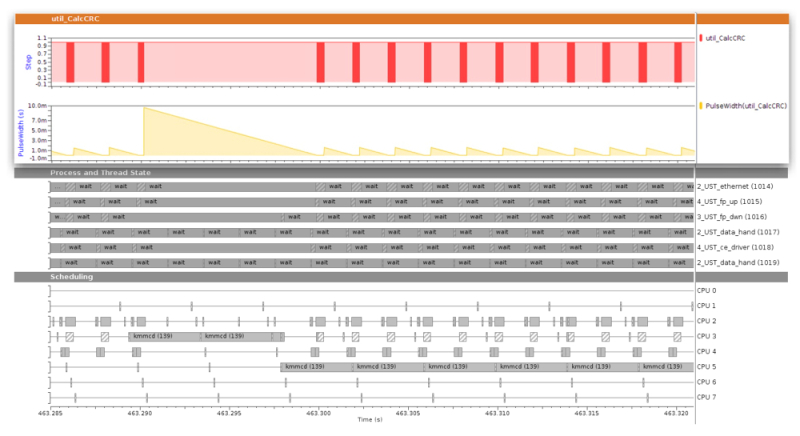
Figure 5
Graphs deduced from other graphs. The yellow graph shows interval-width measurements of the red graph above it. It was created to ease orientation among a very large number of intervals present in the trace data (Source: Mentor Graphics – click image to enlarge)
Conclusion
Mentor Graphics has worked to help engineers better understand trace data for decades. Silicon simulation and emulation technologies create very large trace data collections explaining the internal operations and state of semiconductor devices. These technologies have been leveraged by and adapted for Mentor Embedded Sourcery Analyzer to allow the interpretation and analysis of the vast data sets that modern software trace systems generate.
For Linux-based systems, LTTng is an invaluable source of trace data providing the raw material needed for systematic insights into a system. Once the data is present in Sourcery Analyzer, developers can utilize the included measurement and calculation tools to extract or synthesize specific aspects that complement the picture of a multicore system’s run-time interactions and performance.
About the author
Manfred Kreutzer is a Development Engineering Manager at Mentor Graphics’ Embedded Systems Division. Manfred has been leading engineering projects for compilation tools, 3D user interface design tools, power profiling, and tracing tools since 2004. Two of his products have won innovation and ‘best of show’ awards at embedded system conferences in Nuremberg and Silicon Valley in 2010 and 2011 respectively. Prior to Mentor, Manfred worked for an emerging software company specializing on designing development tools for programming digital signal processors.
Contact
Mentor Graphics
Corporate Office
8005 SW Boeckman Rd
Wilsonville
OR 97070
USA
T: +1 800 547 3000
W: www.mentor.com
