How to analyze embedded GUI performance effectively
 Phil Brumby is a Senior Technical Marketing Engineer in the Mentor Graphics Embedded Systems Division.
 The proliferation of portable devices has had a profound impact on how millions of people interact with one another. An entire generation of users has grown up with some type of interactive touchscreen device. This generation no longer perceives a good graphical user interface (GUI) as new or revolutionary, but rather as a standard piece of mobile device functionality.
This demographic has raised expectations and created a new set of GUI design challenges. Any device with an LCD must offer a fluid and intuitive user experience – in essence a smartphone-like experience – from the second it is powered on. This demand exists whether the device is portable or not.
So, getting the GUI right is absolutely critical to a successful design. One clear goal for any GUI methodology must be the delivery of a product that operates in a way that neither impinges nor is detrimental to the overall user experience. No embedded software developer sets out to create a badly performing GUI. But as a project unfolds, tensions between delivering a good GUI and meeting a device’s broader functional specification can strain the developer’s ability to meet agreed-upon standards.
Developers must understand GUI the performance problems a typical end-user might encounter. Using key performance metrics (hardware-based and user-defined), they must carry out various performance analyses to pinpoint bottlenecks and performance degradation issues. Ideally, this approach will be applied throughout the design cycle.
Finding the right tools and environment
To reach their goal, developers must use methods and tools that reach beyond traditional embedded software practices. The kind of analysis needed must satisfy a wide range of requirements because the GUI problems that arise can be complex. They may manifest themselves through user interactions but have root causes that are hidden within a host of complex interrelated subsystems.
Tracing an instance of an application’s runtime behavior is the best way to collect data unobtrusively and efficiently. This approach allows the developer to range system-wide in choosing his or her data points, traversing the application, middleware, and OS layers. The data collected needs be related to key system metrics such as the CPU and system memory, as well as user-defined metrics more directly associated with the GUI. Further, this type of data collection needs to be recorded over flexible periods of time.
Making use of graphical feedback on the data is critical in gaining an overview of the system, for a number of reasons.
- It makes it easier to spot anomalies.
- It is better for large sets of data.
- It helps with problem cases that occur on an irregular basis or after a long period of time.
- It aids in the side-by-side comparison of multi-layered metrics.
Analysis tools such as Mentor Graphics’ Sourcery CodeBench with Sourcery Analyzer (Figure 1) can be used to evaluate the trace data that is logged during the execution of an application. The tool generates graphical overviews of the data over time and, in this way, provides insights into complex system behavior that are otherwise unavailable.
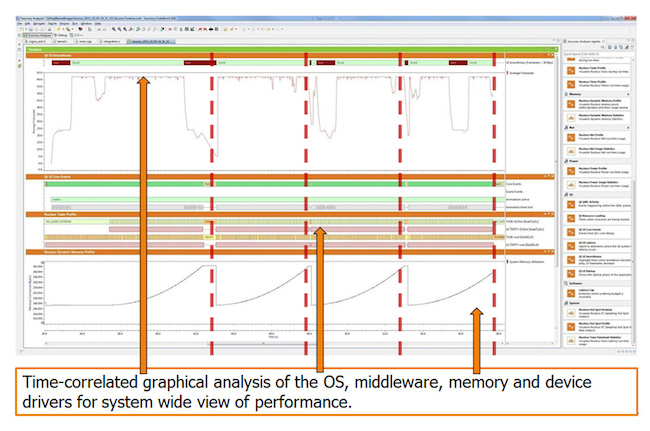
Figure 1: How trace data logs are graphically represented in Sourcery Code Bench (Mentor Graphics)
Troubleshooting the GUI with deep system visualization
GUI-related visualizations should focus on common performance problems experienced by end-users. The foremost are:
- GUI smoothness;
- Start-up time; and
- GUI responsiveness.
Visualizations can flag performance issues, and provide a starting point from which further visualizations can be aligned and analyzed to help tell the whole story of what is happening across the system back to a problem’s origin.
Mentor’s Sourcery Analyzer enables trace visualization for the Qt Platform, one of the embedded industry’s most widely used GUI frameworks. When working within Qt, helpful GUI visualizations can address some of the more common performance issues. Let’s consider the three cited above in more detail.
GUI Smoothness
The graphic for GUI behavior in Figure 2 is measured in frames per second (FPS). Results like these allow developers to focus on animations within the GUI and identify when they fall below the desired frame rate. The developer can then compare the frame-rate drop-off with other system metrics (e.g., task states, CPU load, etc) to pinpoint why the system cannot maintain appropriate performance.
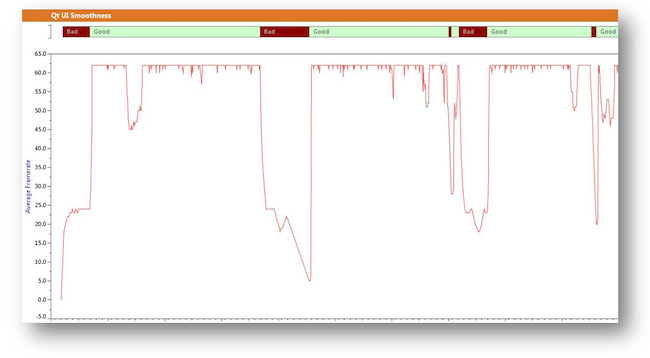
Figure 2: Visually checking frame-rate drops helps you pinpoint a problem – and
devise a solution (Mentor Graphics)
Start-up Time
Figure 3 shows a detailed visual representation of the start-up phases of a GUI application. The process from the first stages of initialization until the first frame is rendered to the screen is a key attribute of start-up performance. Factors involved in viewing system state start-up can range from bootloading, GPU initialization and storage initialization time, to application and GUI design start-up. This analysis is critical to determining GUI performance: being able to view the start-up phases broken down into its various segments allows the developer to gain instant feedback as to which ones are taking too long to execute.
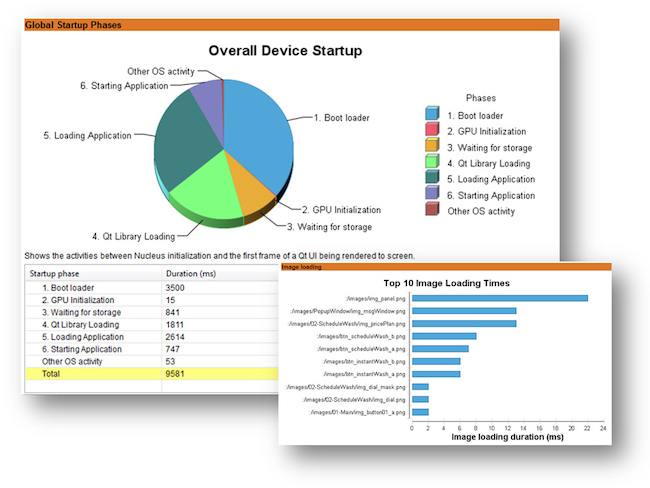
Figure 3: Analyzing selected input events is key to optimizing system start-up (Mentor Graphics)
GUI Responsiveness
The GUI responsiveness metric helps highlight when the delay between an input event and a consequent update to the GUI becomes too great. With this visualization (Figure 4), developers can see when input event processing is too slow or the paint latency is high, again comparing any lengthy periods of response with visualizations from other system layers in a time-correlated manner. An appropriate fix can then be more easily and directly applied.
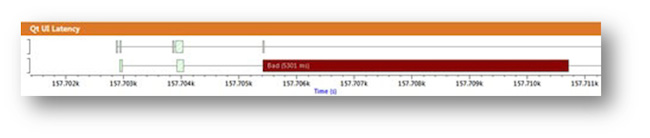
Figure 4: Latency issues can be viewed during selected input levels (Mentor Graphics)
Conclusion
For informed and thorough GUI performance analysis, developers must gather and understand the right system metrics for measuring performance. These metrics show what is happening on the hardware over a fixed period of time.
As mentioned, tracing is a good approach for many embedded systems when investigating performance problems. But it is important to have the capability to process and visualize the large amounts of data generated, especially as system complexity continues to grow.
Performance visualization tools such as Mentor’s Sourcery Analyzer provide deeper and faster insights into difficult GUI problems by performing customized analysis across the OS, GUI framework, and even the application layer.
Visit the Mentor Graphics’ User Interface and Graphics website for more information. Also, more detailed information can be found on the Sourcery Analyzer page.
About the author
Phil Brumby is a Senior Technical Marketing Engineer in the Mentor Graphics Embedded Systems Division. Phil has the responsibility for the technical and engineering development for Mentor’s embedded graphics and user interface product offerings. He previously held a number of senior software engineering roles in the UI and mobile gaming spaces. Phil holds a Master’s degree in Applied Computing and a Bachelor of Science with Honors degree in Mathematics & Statistics from the University of Dundee, Scotland.
