Machine learning and visualization ‘needed for coverage’
Traditional functional coverage has run out of steam and novel methods to improve the understanding of what tests are doing are needed to make progress. That is the view of Greg Smith, director of verification innovation and methodology improvement at Oracle.
At the February DVClub Europe seminar organized by UK-based TV&S, Smith told attendees: “Functional coverage is equivalent to a horse and buggy when we are living in the age of Uber.”
Traditional functional coverage has been outpaced by complexity, Smith said. “When I first came out of school, we didn’t need functional coverage. But complexity has exploded.”
The problem that faces users of functional coverage is that it deals poorly with the contextual information that design and verification engineers need to understand how well a particular section of logic is performing – and whether it is broken or not.
“When the industry invented functional coverage, we could observe that a change occurred and that it caused a particular decision to be made but the observable effect was still local,” Smith argued. The problem is that the effects of that decision may ripple through to far-flung parts of the SoC. Bigger coverage objects would, in principle, capture those effects but those larger objects become prohibitively complex and time-consuming to express.
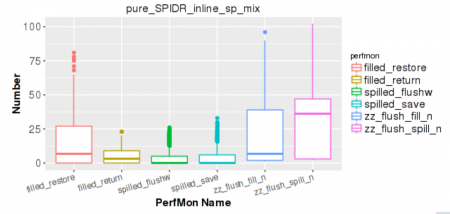
Image Example of a box plot used for rapid evaluation of the effectiveness of various tests (Source: Oracle)
“We’ve got to look at it from a different perspective. At Oracle we decided to use machine learning, or more specifically data science to verifications. It pulls in techniques like statistical analysis, machine-generated random stimulus with feedback and even graph-based modeling and coverage,” Smith said.
“With machine learning, the good news is that the computers are not going to be finding the bugs by themselves anytime soon so your jobs are safe. But machine learning brings new data analysis techniques and provide insights into otherwise hidden aspects of your design. Using the data that is readily available, you can apply it in new ways. You really can get a deep understanding of what your stimulus is doing or not doing. So you can identify where stimulus is working or totally missing.
“At Oracle is we started using statistical analysis and we brought in some visualizations that showed us some things about the stimulus that we had no idea were happening. We also used pure static analysis and looked at metrics at the end of a test to see what happened and ask: was this what we wanted to do?”
Smith said it is relatively easy to get started. “We started by just consuming log file data. Comma-separated value files that we sucked into a database to perform analyses.”
Static analysis of data provided the source of box-and-whisker plots that showed the number of times particular tests were triggered during verification. These graphs helped show where tests were likely failing to do a good job. “You can see how tests have run over time. If a bug morphs you may see that the test is no longer creating the types of event you expect. You can then go and look at why the test is no longer effective.”
Similar analyses are used for pulling tests out of a regression suite to reduce turnaround time without losing effective coverage. “Do I have tests that are doing the same thing? Maybe I want to choose just one of a group of tests.”
The graphical analysis can quickly find tests that are not performing their expected tasks, Smith said. For a particular unit test that was meant to expose three types of stall condition, “the designer found that the third wasn’t getting exercised at all. The irritator had a bug in it and never created the stall condition. This feedback came five minutes after running the tests and [the designer] didn’t have to write the coverage object to check for the condition.”
Genetic algorithms
To help automate verification, Oracle’s engineers are now working on genetic algorithms to alter stimulus to improve the test results based on feedback from prior runs. The work is in its early days and can take a large number of runs to deliver results but on a relatively small block, coverage improved from 72 to 98 per cent. “It took about a week and ten thousand tests but we were seeing how we could incorporate this feedback mechanism,” Smith said. Another application of machine learning was to analyze patterns and sequences from state machines to help determine their overall efficiency.
Smith said speed of feedback is important when using these kinds of analysis, which has an impact on data capture and storage. The analysis routines tend to take longer as the database size scales up. For this reason, the database does not collect data over long periods. Instead, it is reset after about of month of data collection. “We want the analysis to take no more than five minutes,” Smith said.


One Response to Machine learning and visualization ‘needed for coverage’