Mentor zooms in on power peaks with emulator interface
Mentor Graphics has developed a software interface for its Veloce emulators that lets third-party tools fetch logic-activity information from running tasks for faster and more accurate power estimation.
The Dynamic Read Waveform applications programming interface (API) is part of a growing portfolio of software for Veloce designed to track down potential power problems in SoCs. The first tool to use the API is Ansys’ PowerArtist.
Although emulators have been able to export average power usage information in the form of SAIF files or their equivalents, Jean-Marie Brunet, director of marketing at Mentor, said SoC designers have been trying to find ways to get more finely grained data that can identify power peaks likely to affect real-world systems in an environment where dynamic power consumption is getting worse.
FinFET switches power focus
“The finFET is a great transistor that enables Moore’s Law scaling but if we look at the power trends into future, while leakage and memory consumption remain roughly constant switching power has the tendency to grow over time. The finFET is great for static power but dynamic power remains a challenge.”
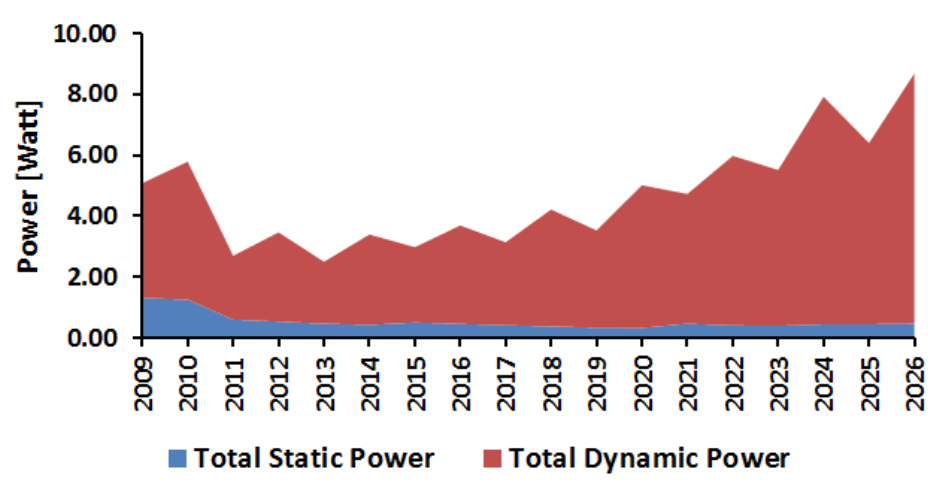
Image Prediction of dynamic and static power from ITRS 2011/2012
The higher switching power is more likely to lead to hotspots during high activity that could cause the SoC to fail as the power and ground buses fail to handle the required current. Brunet said the traditional methodology of extracting SAIF files from a simulation or emulation stimulated by a testbench risks lulling designers into a false sense of security.
“When the die comes back from the fab and the peak power consumption is three times more than predicted, they realize they have a problem,” Brunet said. “We looked at this issues and started to work with early customers nine to twelve month ago. We believe many customers are looking at the problem the wrong way: they are relying very heavily on functional testbenches for power analysis. But they are not capturing processes such as the booting of the OS or running actual applications. They are not capturing reality. You need to look at switching activity over a long period of time.
“But with this approach you are potentially dealing with hundreds of millions of cycles. Simulation will take too long. FPGA prototyping could do it, but you need visibility into every net, and FPGA prototyping is limited on visibility,” Brunet added, pointing to emulation as the better substrate for detailed, long-term power analysis.
“Booting Android probably requires on the order of 350 million cycles,” Brunet said.
Data deluge
The massive number of cycles that an emulator can run and export to a power analysis tool cause their own problem. Compiling the data into SAIF files, which provide a sum of high and low state and total toggle count for a given period of time, results in the power-analysis tools only being able to provide averaged results, which may miss more serious peaks.
Mentor found customers turning to the more detailed signal traces available with FSDB files – the format originally developed for Synopsys’ Verdi debugger. However, as well as sheer size that can result from running millions of cycles, the layout of the file does not fit well with power-analysis tools.
Vijay Chobisa, product marketing manager at Mentor, said: “FSDB uses a signal-based format designed for situations where the tool says ‘give me this signal for this amount of time’. For power analysis you want the switching activity on every clock edge for all of the signals of interest.”
It can take hours for a power estimator to parse the FSDB file and rearrange the data into a form it can use. As the inefficiency of the FSDB-based approach became clear, Chobisa said Mentor started work on a more efficient approach based on an API into the Veloce signal database and one that could be queried while the emulation is running.
“Our flow takes advantage of time-based access rather than signal-based access,” Chobisa said.
Activity tracking
By adding an activity profiler to track usage peaks, Brunet said engineers can home in on times of interest and pull that activity out into a tool such as PowerArtist for analysis or, potentially, run power analysis over long periods of changing activity. In addition to the signal-oriented analysis, the Veloce software continues to support SAIF export as well as input from forward-SAIF files that contain information on expected switching activity.
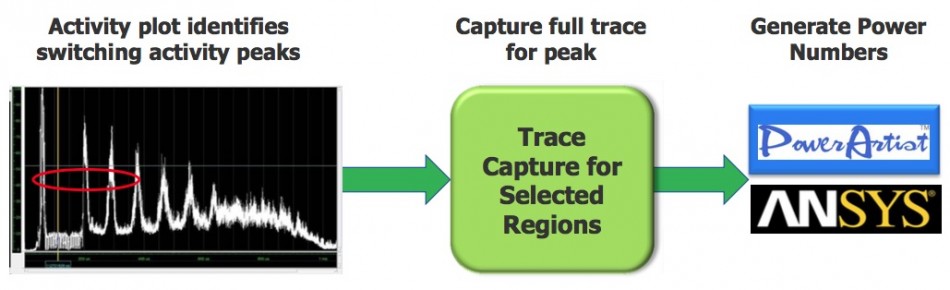
Image The Veloce flow identifies peaks using activity plots and then extracts switching behavior
Based on tests by Mentor, bypassing the FSDB file-parsing stage leads to overall speeds up two to four times for runs that involves tens of millions of cycles. The emulator and power tool can run at the same time and so overlap processing. “Most of the time, the data is being passed across live,” Brunet said.
So far, the only third-party tool to support the API is PowerArtist but Mentor is looking to add others to the list. “Customers asked for PowerArtist,” Brunet claimed.
Mentor is currently running the software to a limited set of customers but aims to move to full production by the end of the year.
